
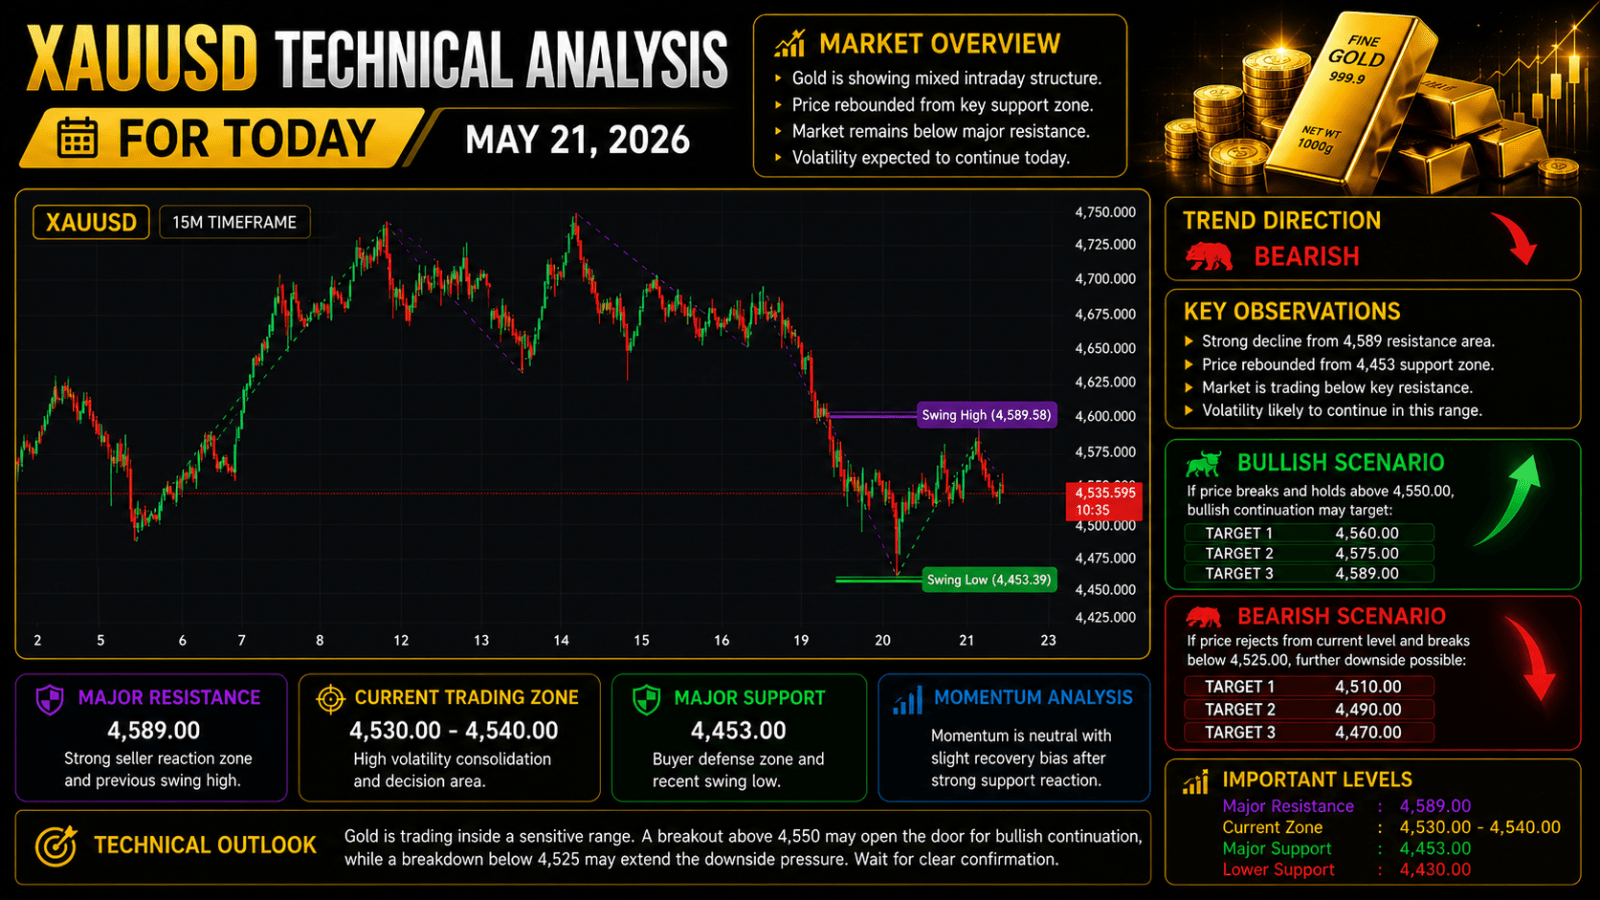
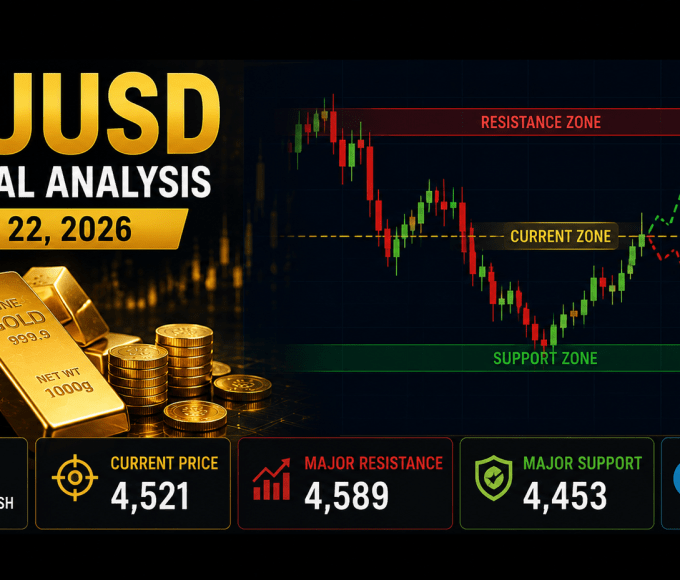
Gold prices are currently moving inside an important technical structure according to the latest XAUUSD chart behavior. The recent market movement shows that price experienced a strong bearish wave before buyers started defending lower support levels. Based on the latest chart structure provided, the market recently created a swing high near 4,589 and later formed a swing low around 4,453. The current trading price remains near the 4,530 to 4,540 region where market participants continue fighting for directional control. This area has become technically important because price is now attempting to stabilize after a sharp decline while still remaining below major resistance levels.
From a broader technical perspective, the recent price action suggests that gold entered a temporary corrective phase after failing to maintain bullish continuation from higher levels. Sellers gained momentum after the market rejected upper resistance zones and created strong downward movement. However, the recent reaction from support levels indicates that buyers are not completely absent from the market. Instead, both sides are currently competing inside a highly sensitive trading structure.
Current market conditions indicate that traders should pay attention to momentum shifts because gold frequently produces aggressive intraday movement once support or resistance zones are tested repeatedly. Price consolidation near important technical regions often acts as preparation before larger directional movement develops.
Price Structure Analysis
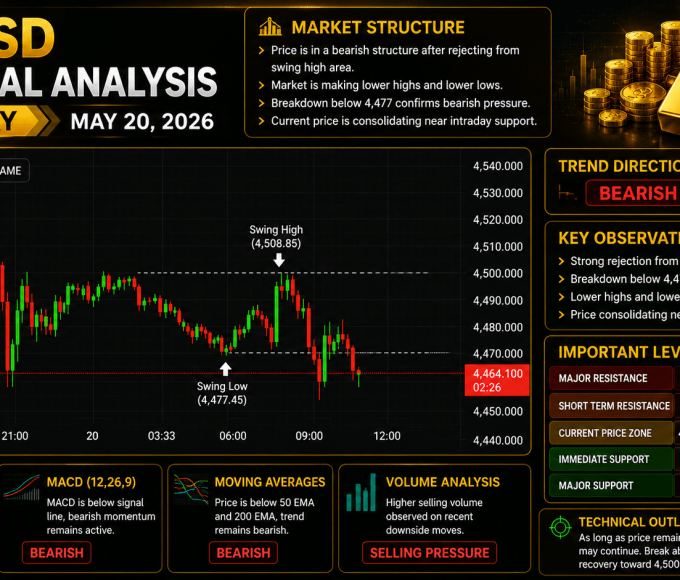
The latest market structure shows a sequence of lower highs following the previous rejection near 4,589. This behavior generally indicates that sellers remain active during recovery attempts. At the same time, the recent rebound from 4,453 suggests that buyers successfully defended lower support and prevented immediate continuation toward deeper downside levels.
The market currently remains trapped between support and resistance boundaries which creates a consolidation environment. During such conditions price frequently generates false breakouts, rapid reversals, and liquidity movements before selecting a stronger trend direction.
Support And Resistance Analysis
Resistance levels remain highly important because sellers previously entered aggressively around upper regions. The first major resistance currently remains near 4,589. This level previously acted as a strong rejection area and may continue attracting selling pressure if price revisits the region.
On the support side, the market recently formed an important defense zone near 4,453. Buyers successfully reacted from this level and created temporary recovery movement. If future price action remains above this support region, recovery potential may continue increasing.
However, if price breaks below the support region, technical sentiment could weaken significantly and expose additional downside movement toward lower targets.
Momentum Analysis
Current momentum appears relatively neutral with a slight recovery bias. Following the previous decline, buyers managed to create upward movement from lower levels. However, momentum still remains weaker than earlier bullish phases because price continues trading under important resistance structures.
Momentum analysis suggests that stronger confirmation is required before a major directional movement becomes more reliable. Until then, short term fluctuations may continue dominating price action.
Bullish Technical Scenario
If buyers successfully maintain price above the current region and continue generating higher movement, gold could attempt movement toward 4,560 followed by 4,575. Stronger continuation could eventually retest the previous swing region around 4,589.
Bullish continuation generally becomes more reliable if price creates sustained movement above resistance levels while maintaining stable buying pressure.
Bearish Technical Scenario
If sellers regain strength and price fails maintaining support, downside movement may reappear. Initial selling targets may develop near 4,510 followed by 4,490. Stronger selling continuation may expose 4,470 and potentially deeper regions.
Important Technical Levels Traders Are Watching
| Level | Price Zone | Technical Importance |
| Major Resistance | 4,589 | Strong seller reaction zone |
| Current Trading Zone | 4,530 to 4,540 | High volatility consolidation region |
| Major Structural Support | 4,453 | Buyer defense region |
| Lower Support | 4,430 | Extended downside target |
Technical Outlook For Today
Overall technical analysis suggests that XAUUSD remains inside a highly sensitive price region where confirmation will be necessary before stronger directional movement develops. Buyers recently defended lower support levels and generated temporary recovery movement, but price still remains below major resistance. Until stronger breakout confirmation appears, traders may continue seeing rapid volatility, liquidity sweeps, and unstable short term movement across today’s trading session.
Risk Warning: Trading gold carries significant risk. Educational purposes only. Not financial advice.


