
📅 May 5, 2026 | ✍️ LiveGoldSignal.com | ⏱️ 7 min read
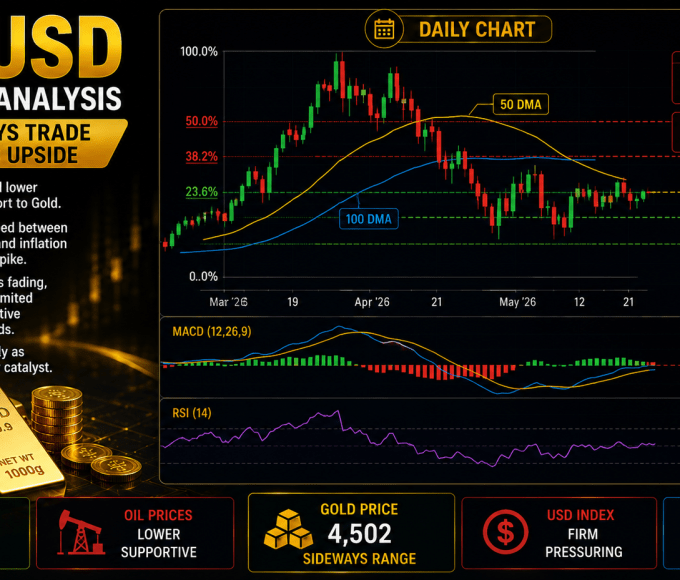
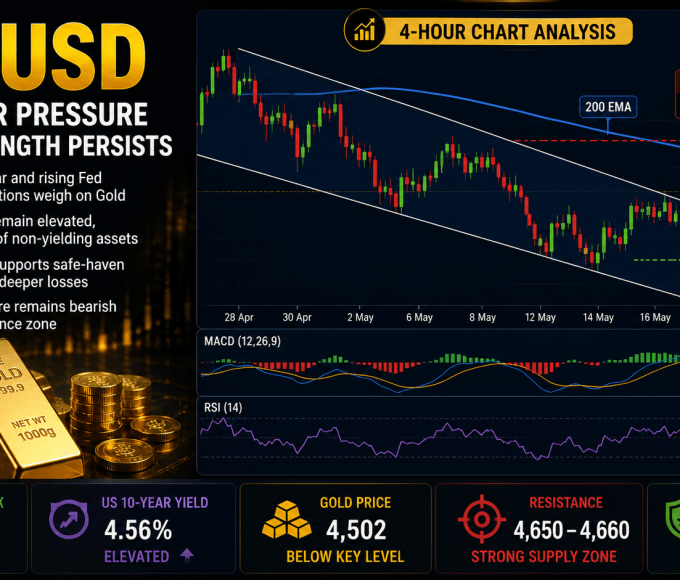
While gold trades at $4,521 amid Hormuz headlines, the Reserve Bank of Australia raised rates by 25 basis points at its May meeting — joining the Bank of Japan and European Central Bank in a globally synchronised tightening cycle driven entirely by the Iran war’s energy price shock. Simultaneously, Morgan Stanley published analysis showing gold ETFs represent just 0.17% of US private financial assets — a reading the bank describes as “massively underweight” — and quantifying that a return to historical norms would generate demand that dwarfs annual global mine supply. These two developments — global tightening broadening, and institutional gold vastly underallocated — are the structural bookends that define gold’s medium-term outlook regardless of today’s Hormuz volatility.
RBA Hikes 25bps — The Iran War’s Global Monetary Impact
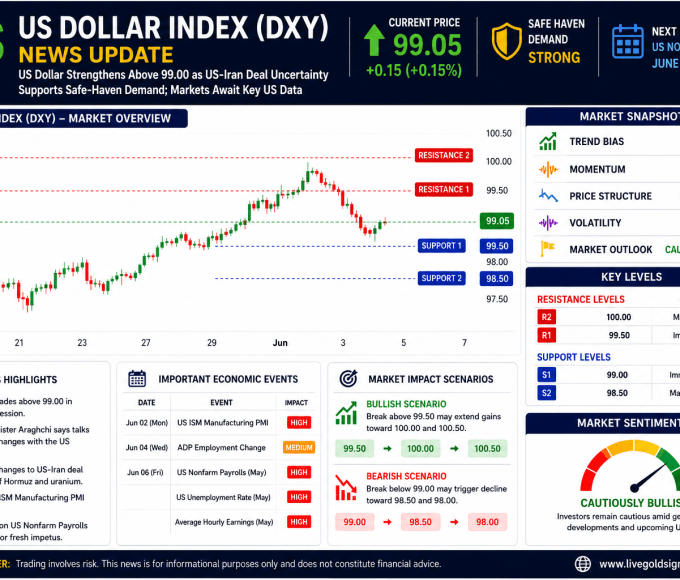
The Reserve Bank of Australia’s decision to raise its cash rate by 25 basis points to 4.60% at its May 2026 meeting is directly attributable to the Hormuz blockade’s impact on Australian energy import costs. Australia’s CPI has returned above 4% — above the RBA’s 2–3% target band — driven by elevated refined fuel costs from disrupted Asian energy supply chains. The RBA’s statement explicitly referenced “elevated energy prices reflecting global supply disruptions.” FX Leaders confirms the global pattern: “the Bank of Japan showed a growing willingness to raise rates as inflation risks rise, while the European Central Bank signalled that another hike could come as soon as” the June meeting. The Federal Reserve’s hawkish hold, the RBA’s hike, BoJ tightening signals, and ECB guidance together represent the most globally synchronised tightening episode since 2022. And 2022 is precisely the template analysts are now citing as gold’s 2026 playbook — a supply-side shock drives global tightening, gold corrects, then fully recovers as the cycle peaks.
The 2022 parallel is compelling. In 2022, gold fell approximately 22% from its March high as the Fed raised rates 425 basis points. Then it recovered 100% of the correction as the rate cycle peaked and central bank buying provided the structural floor. The current 2026 decline of approximately 19% from the January ATH mirrors the 2022 correction magnitude — and central bank buying in 2026 (projected 755 tonnes) is running at more than double the 2022 pace (approximately 300 tonnes). If the playbook repeats, the recovery from whatever proves to be the 2026 correction low will be faster and more powerful than 2022, driven by the combination of rate cycle peaking and structurally elevated sovereign demand.
Global Central Bank Rate Actions — May 2026
| Central Bank | Current Rate / Action | Reason |
|---|---|---|
| US Federal Reserve | Hold 3.50–3.75% | CPI 3.3%, energy shock — hawkish hold |
| Reserve Bank of Australia | Hike to 4.60% (+25bps) | CPI above 4%, Hormuz energy impact |
| Bank of Japan | Hawkish — hike expected | Yen weakness + imported inflation |
| European Central Bank | June hike signalled | Energy pass-through to Eurozone CPI |
| Bank of England | Hawkish hold | UK energy costs elevated |
Morgan Stanley: 0.17% Allocation — The Structural Case in One Number
Morgan Stanley’s portfolio strategy note calculates that gold ETFs represent just 0.17% of total US private financial assets — the lowest ratio in the modern gold ETF era and a figure that the bank describes as “massively underweight” relative to both historical norms and the current macro risk environment. To understand the implications, consider the mathematics of a reallocation. US private financial assets total approximately $140 trillion. At 0.17%, gold ETFs represent approximately $238 billion in holdings. A return to the 2012 peak allocation of 0.5% would require $462 billion in additional gold ETF purchases — equivalent to approximately 100,000 tonnes at current prices, or nearly 29 years of global mine supply. Even a return to half the 2012 peak — 0.3% allocation — would require $184 billion in new purchases, or approximately 40,000 tonnes, vastly exceeding annual mine supply capacity.
The Morgan Stanley analysis identifies five macro factors that make reallocation toward gold logically necessary for US institutional investors right now: persistent inflation above the Fed’s 2% target, a slowing economy raising recession risk, elevated stock-bond correlation eliminating the traditional 60-40 portfolio’s diversification benefits, geopolitical risk at multi-decade highs, and rising government debt creating long-term currency debasement concerns. Each of these factors individually supports a higher gold allocation. Together, they make the case for institutional reallocation from 0.17% toward 3–5% — the range that portfolio optimisation models suggest for the current environment — essentially unanswerable from a risk management perspective. The only constraint is the pace at which large, cautious institutions move — which is slow. But slow and inexorable, applied to $140 trillion in assets, produces demand that overwhelms supply for years, not months.
Gold Mine Supply — Why the Market Cannot Self-Correct
One of the most important structural features of the gold market — and one that is frequently underappreciated — is the complete inability of supply to respond quickly to price signals. Global annual gold mine production is approximately 3,500 tonnes. This figure has been relatively stable for the past decade despite gold prices rising from $1,200 to $4,500+, because developing a new gold mine takes 7–15 years from initial discovery through environmental permitting, construction, and commissioning to first production. The mines producing gold today were approved and developed when gold was $1,500–$2,500 per ounce. The current $4,521 price is incentivising exploration and new project announcements — but those new projects will not produce gold until 2032–2035 at the earliest. In the interim, supply remains approximately 3,500 tonnes annually. Central bank demand alone at 755 tonnes projected for 2026 consumes 21.6% of this supply. ETF demand, bar and coin investment, and jewellery absorb the remaining 78.4%. There is structurally no surplus supply available to meet any meaningful institutional reallocation from the current 0.17% level — which is why even a modest increase in institutional allocation translates directly into price appreciation rather than supply expansion. The Morgan Stanley 0.17% number, viewed through the lens of physical supply constraints, is the single most powerful structural argument for gold’s multi-year price trajectory.
📌 News Summary — May 5: RBA hiked +25bps to 4.60% — global tightening broadening (RBA, BoJ, ECB all tightening). All driven by Hormuz energy inflation. Morgan Stanley: gold ETFs at 0.17% of US private assets — “massively underweight.” Return to 0.3% allocation = $184bn new demand = 40,000 tonnes — vastly exceeds annual mine supply of 3,500 tonnes. 2022 gold playbook: 22% correction then full recovery — current 19% decline mirrors structure. Central bank buying 2026 projected 755 tonnes — 2× the 2022 pace. Supply cannot respond — 7–15 years from discovery to production. The structural case for gold’s recovery is not just intact — it is stronger at $4,521 than it was at $4,882.
Risk Warning: Trading gold carries significant risk. Educational purposes only. Not financial advice.

