
📅 May 8 2026 | ✍️ LiveGoldSignal.com | ⏱️ 7 min read
Two separate economic stories published this week are reshaping the medium-term outlook for gold in ways that go beyond any single data release or diplomatic headline. First Federal Reserve Bank of Chicago President Austan Goolsbee warned on Thursday that US inflation has not continued to cool toward the central bank’s 2 percent target and has instead accelerated since the outbreak of the Iran war. This statement from a prominent Fed official publicly acknowledges that the stagflation scenario that gold bulls have been describing for months is now an official Federal Reserve characterization of current economic conditions. Second the April NFP consensus of just 62000 jobs released today confirms that the labor market is experiencing the sharpest quarterly deceleration since 2020 with Q2 2026 tracking to average below 80000 jobs per month. The combination of accelerating inflation and decelerating employment is the precise textbook definition of stagflation and it is the most structurally bullish macro environment that gold can exist in.
Goolsbee’s Stagflation Warning: The Fed Officially Sees It
Chicago Fed President Goolsbee’s statement that inflation has accelerated since the Iran war began and has not continued cooling toward the 2 percent target is significant not because it is surprising but because it is official. Market participants have known since the March CPI reading of 3.3 percent and the March PPI reading of 4.0 percent that inflation was re-accelerating. The ISM Manufacturing Prices Index at 78.3 percent in March confirmed that the pipeline of inflation pressure was building at the producer level. What Thursday’s Goolsbee statement adds is the Federal Reserve’s own explicit acknowledgment that the inflation trajectory has changed. This matters for gold for a specific reason: it means the Fed is now publicly on record as seeing inflation accelerating which constrains the committee’s ability to pivot dovishly even if the labor market weakens further. The result is precisely the policy paralysis scenario that gold thrives in. The Fed cannot cut because inflation is accelerating. The Fed cannot raise because growth is slowing and the labor market is weakening. Trapped between two constraints with no clean policy response the real yield on cash and bonds remains structurally lower than headline rates suggest because inflation is eating into the nominal return. Gold which carries no inflation risk and offers zero coupon that cannot be eroded by rising prices becomes the optimal asset in this environment.
The historical parallel that Goolsbee’s statement most closely resembles is Arthur Burns’ Federal Reserve in 1974 to 1975 when the Fed faced the original oil-shock stagflation of the Arab oil embargo. Burns was caught between the same two constraints: oil-driven inflation that exceeded the Fed’s target and an economy sliding into recession from the same energy cost burden. The Fed’s inability to resolve this contradiction with conventional monetary policy tools resulted in gold rising from approximately $150 per ounce in 1974 to $850 per ounce in 1980. Today’s situation is structurally identical though the time horizons are compressed by the speed of modern information transmission and capital flows. The Iran war’s oil shock the Fed’s policy paralysis and the structural central bank demand floor combine to create a 2026 version of the 1974 to 1980 gold environment.
April NFP Structural Weakness: The Real Labor Market Picture
| Month | NFP Headline | Organic Jobs | Key Distortion |
|---|---|---|---|
| January 2026 | Plus 160000 | Plus 160000 | No major distortion clean reading |
| February 2026 | Minus 133000 | Minus 133000 | Iran war shock begins Feb 28 |
| March 2026 | Plus 178000 | Plus 102000 | 76000 from healthcare strike return |
| April 2026 consensus | Plus 62000 | Plus 62000 | First full Iran war month no distortion |
| Q2 2026 tracking average | Below 80000 | Below 80000 | Structural deceleration confirmed |
The April NFP consensus of 62000 is the first truly clean reading of how the Iran war is affecting US employment with no strike distortions from the prior month. The Q1 average of 68000 per month was already the weakest since early 2025. If April comes in at or below 62000 it confirms that Q2 is running even weaker than Q1 and that the labor market deceleration is accelerating rather than stabilizing. The sector breakdown will be equally important as the headline. Manufacturing employment has been contracting for 24 consecutive months. Construction employment was the primary positive contributor in prior months but energy cost inflation may have begun to slow new project starts. Any NFP that shows a broadening of job losses beyond the already-contracting manufacturing sector into services and construction would be the most bearish labor market signal since the February shock.
UMich Inflation Expectations: The Consumer’s View
The University of Michigan’s May 2026 inflation expectations survey releasing simultaneously with NFP today provides a crucial dimension that the payroll data alone cannot capture. Consumer inflation expectations are among the most closely watched indicators by Federal Reserve officials because of their potential to become self-fulfilling. When consumers expect higher inflation they demand higher wages. Higher wages increase business costs. Higher business costs raise prices. This wage-price spiral is the transmission mechanism that converts a supply-side energy shock into a more persistent structural inflation problem. The April UMich reading showed expectations at approximately 4.8 percent. If May shows expectations continuing to rise toward 5.0 percent or above it signals that consumers are already beginning to build the energy price shock permanently into their forward expectations rather than treating it as a temporary event that will resolve when the Hormuz situation is settled. For gold persistently elevated consumer inflation expectations are structurally bullish because they validate the inflation hedge thesis regardless of what the Fed does with nominal interest rates. Even if the Fed raises rates to 4.5 percent real rates would remain near zero if inflation expectations are at 5.0 percent providing no meaningful opportunity cost to holding gold.
The Stagflation Matrix: How Different Economic Outcomes Affect Gold
| Inflation | Growth | Fed Response | Gold Outcome |
|---|---|---|---|
| High accelerating | Slow decelerating | Paralyzed hold | Strongly bullish stagflation premium |
| High stable | Slow decelerating | Hold then cut | Bullish rate cut expectations |
| Falling | Slow decelerating | Cut aggressively | Very bullish lower real yields |
| High accelerating | Strong growing | Hike | Short-term bearish then bullish |
| Falling | Strong growing | Hold | Neutral to mildly bearish |
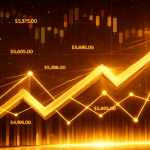
The stagflation matrix above illustrates why the current environment where inflation is accelerating (Goolsbee confirmed) and growth is slowing (Q1 GDP 1.4 percent Q2 tracking below 2 percent) is the most structurally bullish outcome for gold. The Fed is paralyzed: it cannot cut because inflation is rising and it cannot hike aggressively because growth is already slowing. The result is real interest rates that remain structurally suppressed providing no meaningful competition for gold as a store of value. Central banks globally are adding gold at a pace of approximately 244 tonnes per quarter. Institutional investors are sitting at a 0.17 percent gold allocation that Morgan Stanley describes as massively underweight. The Basel III regulatory framework makes commercial bank gold holdings compulsory for liquidity purposes. Against this backdrop of structural demand the stagflation policy paralysis provides the medium-term price support that keeps gold from declining significantly even when short-term technical or diplomatic factors create brief corrections like the April 21 to May 5 pullback from $4882 to $4510.
May 12 CPI: The Next Major Catalyst After Today
Whatever today’s NFP produces the next major market-moving data point is the April CPI releasing on Monday May 12. The March CPI came in at 3.3 percent year on year. The April reading will be the first to incorporate a full month of the Hormuz closure’s effect on energy prices as well as the first partial effect of the diplomatic progress that has pulled oil off its March highs of $112. The consensus for April CPI is approximately 3.2 to 3.5 percent year on year. An April CPI below 3.0 percent would be a powerful signal that the diplomatic progress on the MOU is already beginning to feed through into lower energy prices and therefore lower consumer inflation. This scenario combined with today’s weak NFP would be the strongest possible data combination for a gold rally through $4879 Fibonacci 0.618 and toward $5000 before month-end. An April CPI above 3.5 percent would confirm Goolsbee’s warning that inflation is re-accelerating validate the stagflation thesis and provide medium-term structural support at current gold levels while potentially limiting the near-term upside until the Fed responds to the data.
📌 News Summary May 8: Goolsbee: inflation has accelerated since Iran war began and has not cooled toward 2 percent target. Fed officially acknowledges stagflation conditions. NFP April consensus 62000 first clean reading without distortions. Q2 tracking below 80000 per month structural deceleration confirmed. UMich May inflation expectations simultaneous release today. Stagflation matrix: paralyzed Fed plus high inflation plus slow growth equals most bullish gold environment. May 12 CPI next major catalyst. The structural case: Goolsbee’s statement makes the stagflation scenario official. Gold at $4699 is the inflation hedge for an economy that the Fed itself acknowledges is experiencing accelerating inflation and slowing growth simultaneously.
Risk Warning: Trading gold carries significant risk. Past performance is not indicative of future results. Educational purposes only. Not financial advice.
