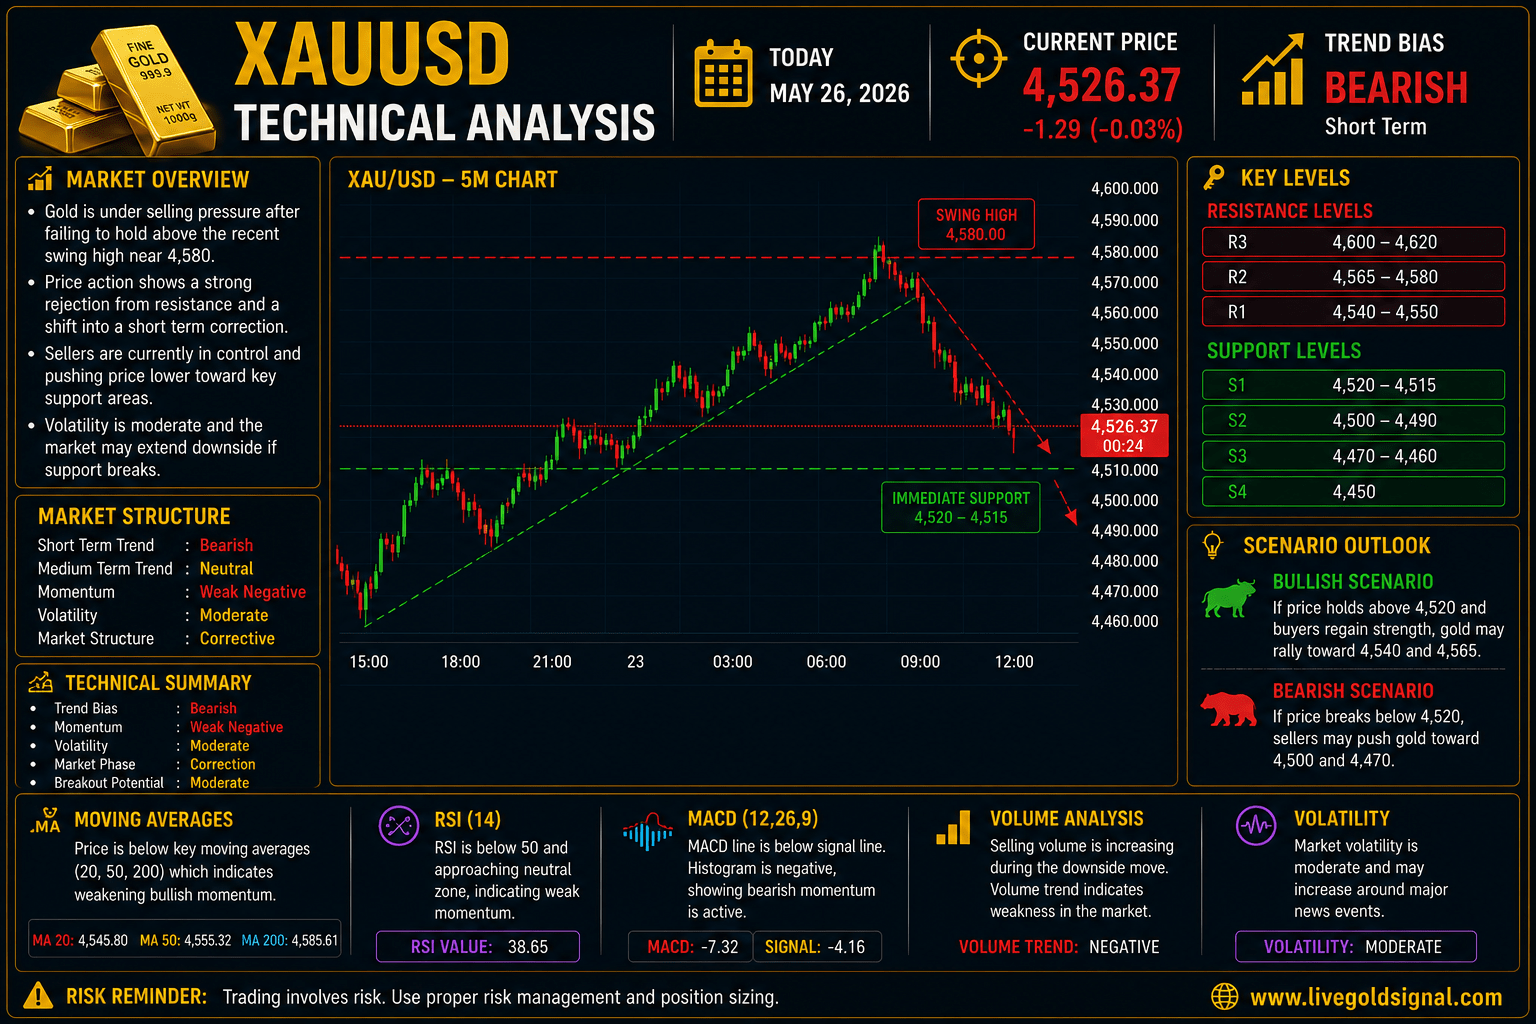
Gold continues trading under noticeable selling pressure during today’s session after failing to sustain bullish momentum near the recent swing high area. The latest market structure suggests that price action has entered a corrective phase where sellers are attempting to gain short term control. Although Gold previously maintained a gradual upward movement and established higher lows, recent rejection from resistance has changed the immediate technical outlook.
The current chart structure indicates that bearish pressure increased after buyers failed to break through the upper resistance region. Strong selling activity entered the market near the swing high zone and pushed price lower within a relatively short period. Such behavior frequently suggests that larger market participants are protecting resistance levels and reducing bullish positions.
From a broader technical perspective, Gold is currently trading in an important area where both buyers and sellers are competing for control. The next directional move will likely depend on whether support levels can hold against current selling pressure.
Current Market Structure Analysis
The recent market structure initially showed bullish continuation characteristics. Price created higher lows and gradually moved toward stronger resistance levels. However, after reaching the upper swing region, momentum started weakening and sellers began dominating short term price action.
A sequence of lower highs now appears on smaller timeframes, which often serves as an early indication that momentum is shifting toward the downside. Technical traders frequently monitor these structural changes because they provide insight into possible future price direction.
The recent downward movement does not automatically confirm a larger trend reversal. Financial markets regularly experience temporary pullbacks even during broader bullish trends. Therefore, additional confirmation remains necessary before assuming an extended bearish phase.
| Technical Factor | Current Reading |
|---|---|
| Short Term Trend | Bearish |
| Medium Term Trend | Neutral |
| Momentum | Weak Negative |
| Volatility | Moderate |
| Market Structure | Corrective |
Support Level Analysis
Support zones represent areas where buyers may become active and potentially slow or reverse downside movements. Current technical structure highlights several important support regions below market price.
| Support Level | Importance |
|---|---|
| 4520–4515 | Immediate Support |
| 4500–4490 | Major Support |
| 4475–4460 | Secondary Support |
| 4450 | Critical Support |
The immediate support zone around current price remains extremely important. If buyers defend this region successfully, Gold could experience a temporary recovery phase.
However, a sustained breakdown below these support levels may accelerate selling activity and expose lower price zones.
Resistance Level Analysis
Resistance levels represent areas where sellers may re-enter the market and limit bullish attempts. Several important resistance regions are visible on the current chart.
| Resistance Level | Importance |
|---|---|
| 4540–4550 | Immediate Resistance |
| 4565–4580 | Major Resistance |
| 4600–4620 | Strong Supply Zone |
| 4650–4680 | Extended Resistance |
Moving Average Analysis
Moving averages continue providing valuable information regarding overall market direction and trend strength. Price currently trades below key short term average areas, which indicates weakening bullish momentum.
When prices remain below moving averages for extended periods, traders often interpret this as evidence of increasing selling pressure. However, moving averages should never be used independently because they often lag market conditions.
Momentum Analysis
Momentum indicators suggest that bearish pressure has increased compared with previous sessions. Although downside momentum appears stronger than bullish momentum, current readings do not yet indicate extreme conditions.
This creates the possibility of temporary consolidation or corrective recovery before another larger movement develops.
Price Action Outlook
Current price action remains focused around support levels near the present market area. If buyers manage to defend these regions and generate stronger demand, Gold could attempt a recovery toward higher resistance levels.
Alternatively, continued selling pressure and lower highs may strengthen bearish sentiment and encourage deeper downside movement.
Technical Conclusion
Overall technical analysis suggests that Gold currently maintains a moderately bearish short term outlook after failing near resistance and entering a corrective structure. Sellers currently hold temporary control, though larger trend confirmation still remains incomplete.
Traders should continue monitoring price behavior near major support and resistance zones because future movement will likely depend on breakout or rejection signals around these important technical areas.