Gold prices remained under strong bearish pressure throughout the recent trading sessions as sellers continued dominating the market structure. XAU/USD traded near the 4,375 zone after failing to hold above several important intraday resistance areas. The latest market movement clearly shows that bearish momentum is still active across lower and medium timeframes, while buyers are struggling to regain control. Strong US Dollar demand, rising Treasury yields, and persistent uncertainty regarding future Federal Reserve policy continue weighing heavily on gold prices.
From the technical perspective, the overall market structure remains weak after the sharp breakdown below multiple short term support levels. Price action on the intraday chart continues creating lower highs and lower lows, which is one of the strongest signs of an active bearish trend. Every recovery attempt during the recent sessions was met with fresh selling pressure, indicating that institutional sellers are still active near resistance zones.
The latest price action also confirms that traders are currently focusing more on downside continuation rather than a bullish reversal. Gold attempted several rebounds during the Asian and European trading sessions, but buyers failed to maintain momentum above important resistance barriers. This continuous rejection from higher levels reflects weak bullish confidence and supports the broader bearish outlook.
Current Market Structure
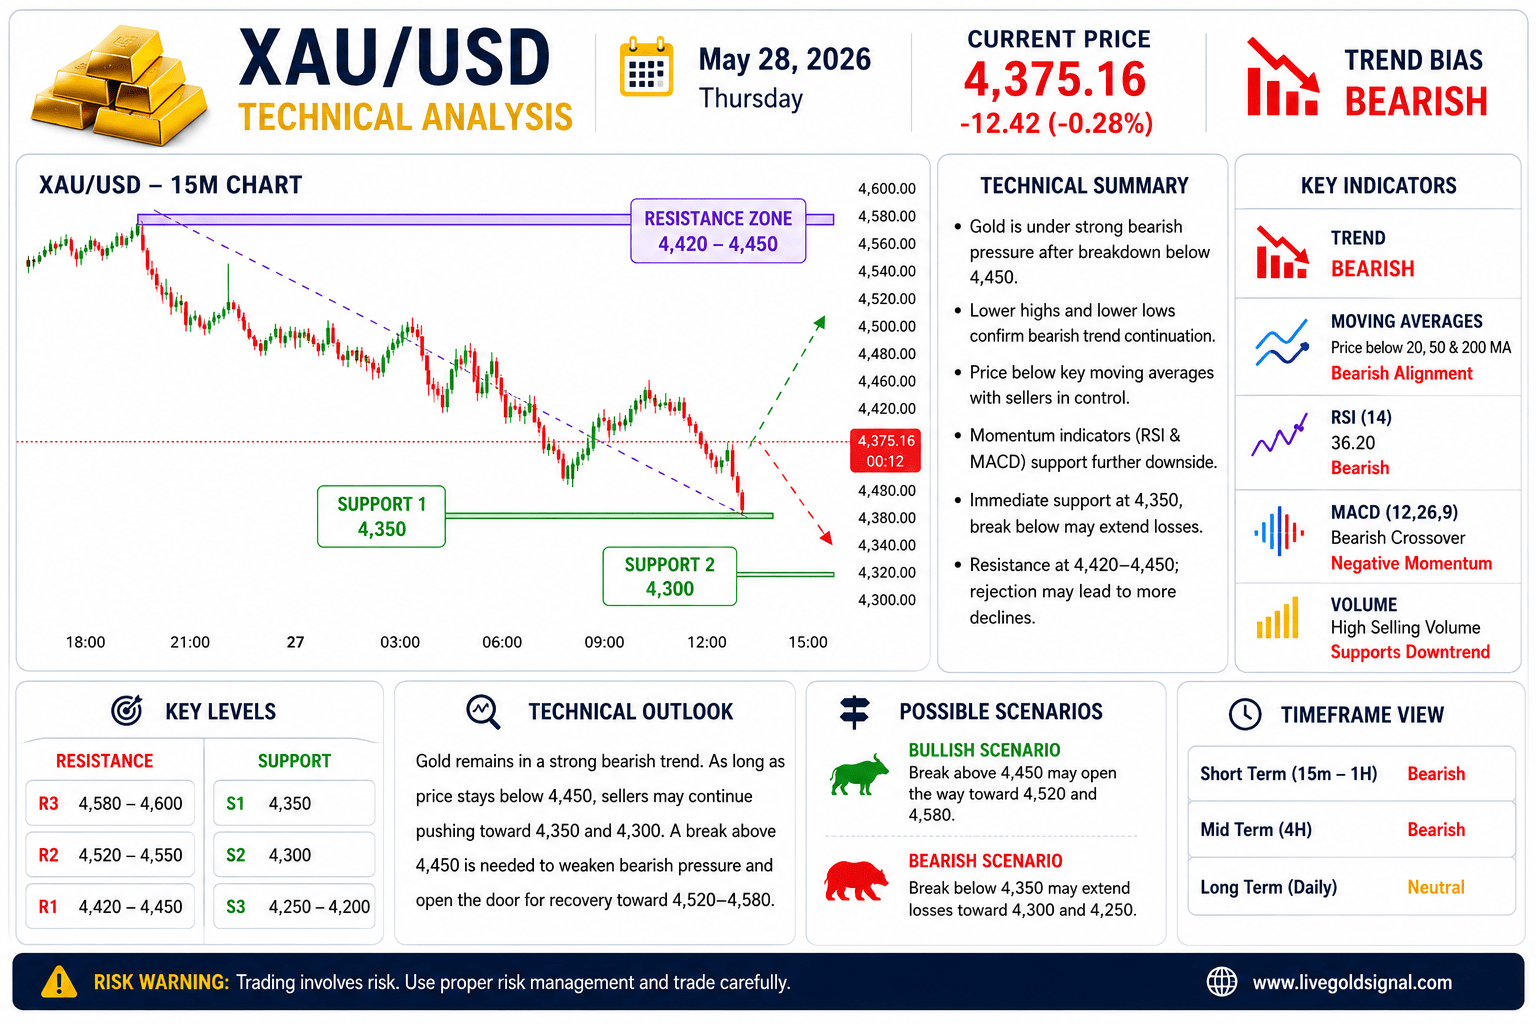
The short term market structure on the 5 minute and 15 minute charts remains strongly bearish. After breaking below the 4,450 support area, gold accelerated sharply toward lower zones and eventually touched the 4,375 area. The sharp decline created panic selling among short term traders, which further strengthened bearish momentum. Price is now trading significantly below previous swing highs, and the descending trendline visible on the chart continues acting as dynamic resistance. As long as gold remains below this falling resistance structure, the probability of additional downside movement will remain elevated. Another important factor supporting bearish momentum is the inability of buyers to create a sustainable recovery pattern. Normally, bullish reversals require strong higher lows and consistent buying candles. However, current price action continues showing weak recovery attempts followed by aggressive bearish continuation candles. This indicates that sellers are still controlling overall market direction.
Resistance Levels Analysis
The nearest resistance zone is currently located around 4,420 to 4,450. This area previously acted as support before the breakdown occurred. After the breakdown, the same zone has now turned into strong resistance, following the classic support turned resistance market behavior.
If gold attempts a recovery move during upcoming sessions, sellers are expected to become active again around this region. Strong rejection candles near this area may confirm another bearish continuation wave. Traders will closely monitor price behavior around this resistance cluster for fresh short selling opportunities. The second major resistance area remains near 4,480 to 4,520. This zone contains previous swing highs and multiple failed bullish breakout attempts. Even if buyers manage to push prices higher in the short term, this resistance region could become extremely difficult to break without strong fundamental catalysts.
Above that, the larger resistance barrier stands near the 4,580 level. This area previously served as a major supply zone where institutional selling pressure entered aggressively. A sustained move above this level would be required to weaken the broader bearish structure. Until then, rallies may continue facing heavy selling pressure.
Support Levels Analysis
On the downside, immediate support is currently located around 4,350. This level represents the latest intraday reaction zone where temporary buying interest appeared. However, if sellers manage to break below this support, bearish momentum may accelerate quickly toward lower levels.
The next major support area can be seen near 4,300. This zone may become an important psychological support for short term traders. If gold reaches this region, volatility could increase significantly because buyers may attempt another recovery move from this area. Below 4,300, the market may open the door toward deeper bearish continuation. In such a scenario, panic selling could increase rapidly, especially if the US Dollar continues strengthening simultaneously. Traders should remain cautious because strong downside momentum often creates sharp and fast price swings.
Moving Average Analysis
Moving averages are currently supporting the bearish outlook across multiple timeframes. Price remains below the short term and medium term moving averages, which confirms that sellers continue dominating momentum.
The 20 period moving average has already crossed below the 50 period moving average on lower timeframes. This bearish crossover is generally considered a strong technical signal supporting downside continuation. Furthermore, price is consistently rejecting from moving average resistance zones during recovery attempts. The wider distance between price and the longer term moving averages also highlights the current weakness in bullish momentum. Unless gold starts closing above these moving averages again, technical sentiment may remain negative.
RSI Indicator Analysis
The Relative Strength Index currently reflects weak market momentum. RSI values remain below the neutral 50 level, indicating that bearish pressure still dominates the market. Although occasional rebounds may occur from oversold conditions, the overall RSI structure continues favoring sellers.
Another important observation is that RSI recovery attempts remain limited. Strong bullish reversals usually require RSI to recover aggressively above 50 and maintain higher momentum readings. However, current RSI movement remains weak and unstable, suggesting that buyers are not yet gaining strong confidence. If RSI drops further toward oversold territory again, gold may experience another sharp bearish continuation phase. Traders often use RSI divergence signals to identify potential reversals, but currently no major bullish divergence is visible on the chart.
MACD Indicator Analysis
The MACD indicator also supports the bearish scenario. The MACD line remains below the signal line, while histogram bars continue printing negative momentum. This setup confirms that downside pressure remains dominant in the current market structure.
Although histogram size occasionally decreases during small recovery attempts, momentum quickly shifts back toward sellers after every rejection candle. This repeated pattern highlights the strength of bearish control in the market. For bullish momentum to strengthen meaningfully, traders would need to see a confirmed MACD crossover combined with stronger buying candles and higher volume participation. At the moment, those conditions are still absent.
Volume And Volatility Analysis
Market volume behavior during the latest decline also supports the bearish trend. Selling activity increased significantly during major breakdown candles, indicating that large market participants were actively involved in the downside move.
At the same time, volatility has expanded sharply. Increased volatility during bearish conditions often reflects panic selling and uncertainty among traders. This environment can create rapid intraday swings, making risk management extremely important. High volatility environments often produce false breakouts and sudden reversals. Therefore, traders should avoid emotional decision making and focus on disciplined trade management strategies.
US Dollar And Fundamental Pressure
One of the biggest factors pressuring gold remains the strong US Dollar. As the Dollar Index continues recovering, gold faces additional downside pressure because stronger dollar conditions reduce demand for non yielding assets like gold.
Federal Reserve expectations are also playing a major role in market direction. Traders currently believe that US interest rates may remain elevated for a longer period due to inflation concerns. Higher interest rates generally weaken gold demand because investors shift toward yield generating assets. Treasury yields also remain an important market driver. Rising yields continue attracting capital flows toward the US Dollar while reducing gold’s attractiveness. Unless yields begin falling significantly, gold may continue struggling to recover strongly.
Short Term Trading Outlook
In the short term, gold may continue trading under bearish pressure unless buyers manage to reclaim key resistance levels. As long as price remains below the 4,450 resistance zone, sellers are likely to maintain market control.
A confirmed breakdown below 4,350 could trigger another strong bearish wave toward 4,300 and potentially lower levels. Traders should monitor price action carefully around support zones because volatility may increase rapidly during breakdown conditions. On the bullish side, any recovery above 4,450 may temporarily slow bearish momentum. However, stronger confirmation would still be required above 4,520 and 4,580 before the broader bearish outlook weakens significantly.
Risk Management Considerations
Current market conditions remain highly volatile, which makes proper risk management extremely important. Traders should avoid oversized positions and always use stop loss protection during active market sessions.
Intraday traders should remain cautious around major US economic data releases because sudden volatility spikes may trigger rapid price movements. Maintaining disciplined trade execution and avoiding emotional trading decisions can help reduce unnecessary losses. Traders should also monitor geopolitical developments, Federal Reserve comments, and Treasury yield movement closely because these factors may continue influencing gold direction significantly in the coming sessions.
Final Technical Outlook
Overall, the technical outlook for gold remains bearish while price continues trading below major resistance levels and descending trend structures. Sellers remain in control across multiple timeframes, supported by weak bullish momentum, strong US Dollar demand, and elevated Treasury yields. The immediate focus now remains on the 4,350 support area. A confirmed breakdown below this zone could expose gold to additional downside pressure toward 4,300 and potentially lower targets. On the other hand, buyers would need a strong recovery above 4,450 and 4,520 to stabilize the market and reduce bearish momentum.
Until stronger bullish confirmation appears, rallies may continue attracting fresh selling interest. Traders should remain cautious and focus on confirmation based price action strategies while monitoring volatility closely during upcoming trading sessions.