
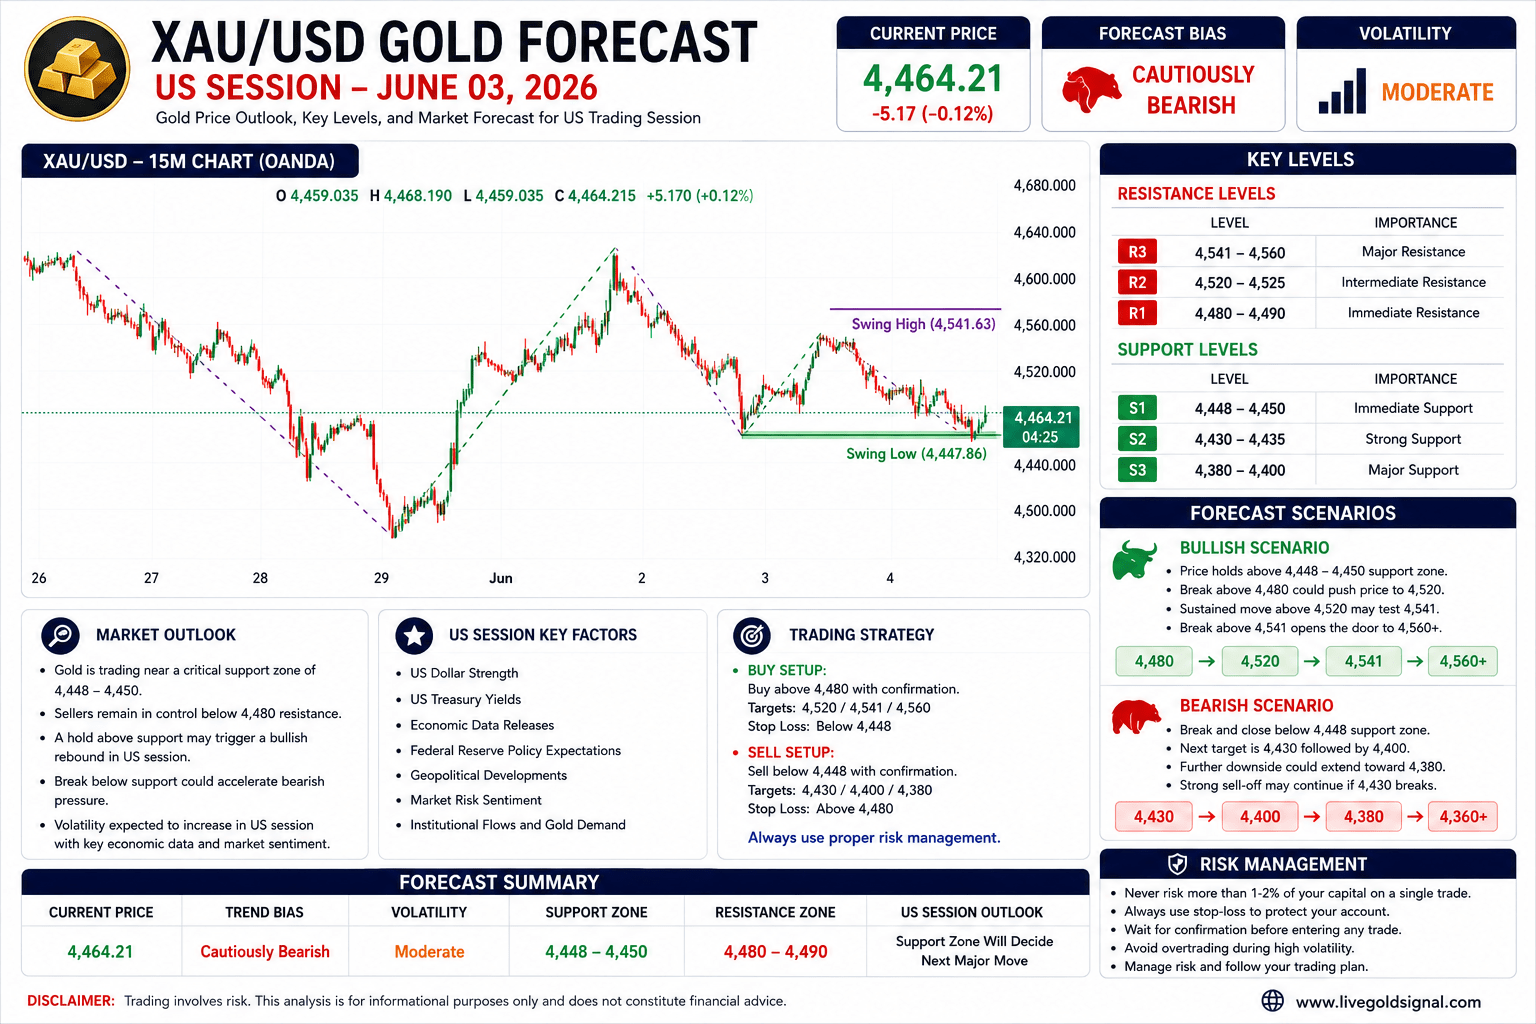
Gold (XAU/USD) remains under pressure heading into the US trading session on June 03, 2026, as price continues to trade near an important support area around 4,448–4,450. Recent market structure shows that buyers have struggled to maintain bullish momentum after failing to break above the 4,541 resistance zone. As a result, sellers regained control and pushed the market back toward a key support region that could determine the next major directional move.
During the Asian and early European sessions, gold remained relatively weak, forming lower highs and lower lows on the intraday structure. The chart indicates that price is currently testing the previous swing low area near 4,447.86. This zone is extremely important because it acted as a strong reaction point during the recent recovery phase. A successful defense by buyers could trigger another rebound toward higher resistance levels, while a breakdown below support may accelerate bearish momentum toward deeper downside targets.
The US session is expected to bring increased volatility as traders position themselves ahead of major economic events and continue evaluating US Dollar strength, Treasury yields, and broader market sentiment. Therefore, traders should closely monitor price action around current support levels before committing to directional positions.
Key Price Levels For US Session
| Level Type | Price Zone | Importance |
|---|---|---|
| R3 | 4,541 – 4,560 | Major Resistance |
| R2 | 4,520 – 4,525 | Intermediate Resistance |
| R1 | 4,480 – 4,490 | Immediate Resistance |
| S1 | 4,448 – 4,450 | Immediate Support |
| S2 | 4,430 – 4,435 | Strong Support |
| S3 | 4,380 – 4,400 | Major Support |
Current Market Structure Analysis
The overall short term structure remains bearish. Since the rejection from the 4,541 swing high zone, the market has consistently produced lower highs while sellers continue defending resistance areas. This pattern suggests that bearish momentum remains active despite occasional recovery attempts from buyers.
One of the most important observations from the chart is the inability of gold to sustain gains above the 4,520 region. Every rally toward resistance has attracted fresh selling pressure, causing price to retreat back toward support. Such behavior often indicates that institutional participants are using higher levels to reduce long exposure or establish short positions.
However, the market has now approached a historically significant support zone around 4,448–4,450. This area previously generated strong buying activity and triggered a sizable rebound. Because of this, traders should be cautious about chasing downside momentum directly into support.
Bullish Forecast Scenario
The bullish scenario will remain valid as long as the 4,448–4,450 support area continues to hold. If buyers successfully defend this zone and generate strong bullish candles during the US session, gold may begin another recovery phase.
In this case, the first target would be the 4,480 resistance area. A successful break above 4,480 could encourage additional buying pressure and open the door for a move toward 4,520. If momentum remains strong and economic conditions support safe haven demand, the market may attempt another challenge of the major 4,541 resistance zone.
A break above 4,541 would significantly improve the technical outlook and could shift sentiment back toward bullish territory. Under such conditions, traders may begin targeting 4,560 and potentially higher levels during subsequent sessions.
Bearish Forecast Scenario
The bearish scenario becomes dominant if gold decisively breaks below the 4,448 support area. Such a breakdown would signal that buyers are no longer capable of defending key support and that sellers have regained complete control of short term price action.
If this occurs, the first downside objective would be 4,430. Further weakness below this level could expose the market to deeper declines toward 4,400 and potentially 4,380. These areas represent major historical support levels and may attract fresh buying interest.
Traders should pay particular attention to volume and candle structure during any support break. Strong bearish momentum accompanied by increasing volume would increase the probability of an extended downside move.
US Dollar Impact
The US Dollar remains one of the most influential factors affecting gold prices. A stronger US Dollar generally creates headwinds for gold because the metal becomes more expensive for international buyers. Recent strength in the Dollar Index has contributed to the pressure observed in gold markets.
If the Dollar continues gaining strength during the US session, gold may struggle to recover and could remain vulnerable to additional selling pressure. Conversely, any weakness in the Dollar could provide support for gold and encourage a bounce from current levels.
Market Outlook
The current market outlook remains cautiously bearish below the 4,480 resistance zone. Price continues trading within a corrective structure, and sellers maintain control unless buyers reclaim higher resistance levels.
At the same time, the market is testing a significant support area, meaning traders should expect increased volatility and possible false breakouts. Patience and confirmation remain essential before entering new positions.
The US session will likely determine whether gold stabilizes and begins a recovery phase or extends its recent decline toward lower support zones.
Risk Management
Risk management should remain the highest priority during the US session. Gold volatility can increase rapidly, particularly around major economic releases and unexpected geopolitical developments. Traders should avoid overleveraging positions and always use appropriate stop loss placement.
Waiting for confirmation at key support and resistance zones can significantly improve trade quality. Avoid emotional decision making and focus on disciplined execution based on technical evidence.
Forecast Summary
| Category | Assessment |
|---|---|
| Current Bias | Cautiously Bearish |
| Major Resistance | 4,541 – 4,560 |
| Immediate Resistance | 4,480 – 4,490 |
| Immediate Support | 4,448 – 4,450 |
| Major Support | 4,380 – 4,400 |
| US Session Outlook | Support Zone Will Decide Next Major Move |
Overall, gold enters the June 03 US session at a critical decision point. The 4,448–4,450 support zone is the most important area to monitor. Holding above support may trigger a recovery toward 4,480 and 4,520, while a breakdown below support could accelerate declines toward 4,430, 4,400 and potentially 4,380. Traders should remain flexible, follow confirmation signals, and apply strict risk management throughout the session.