
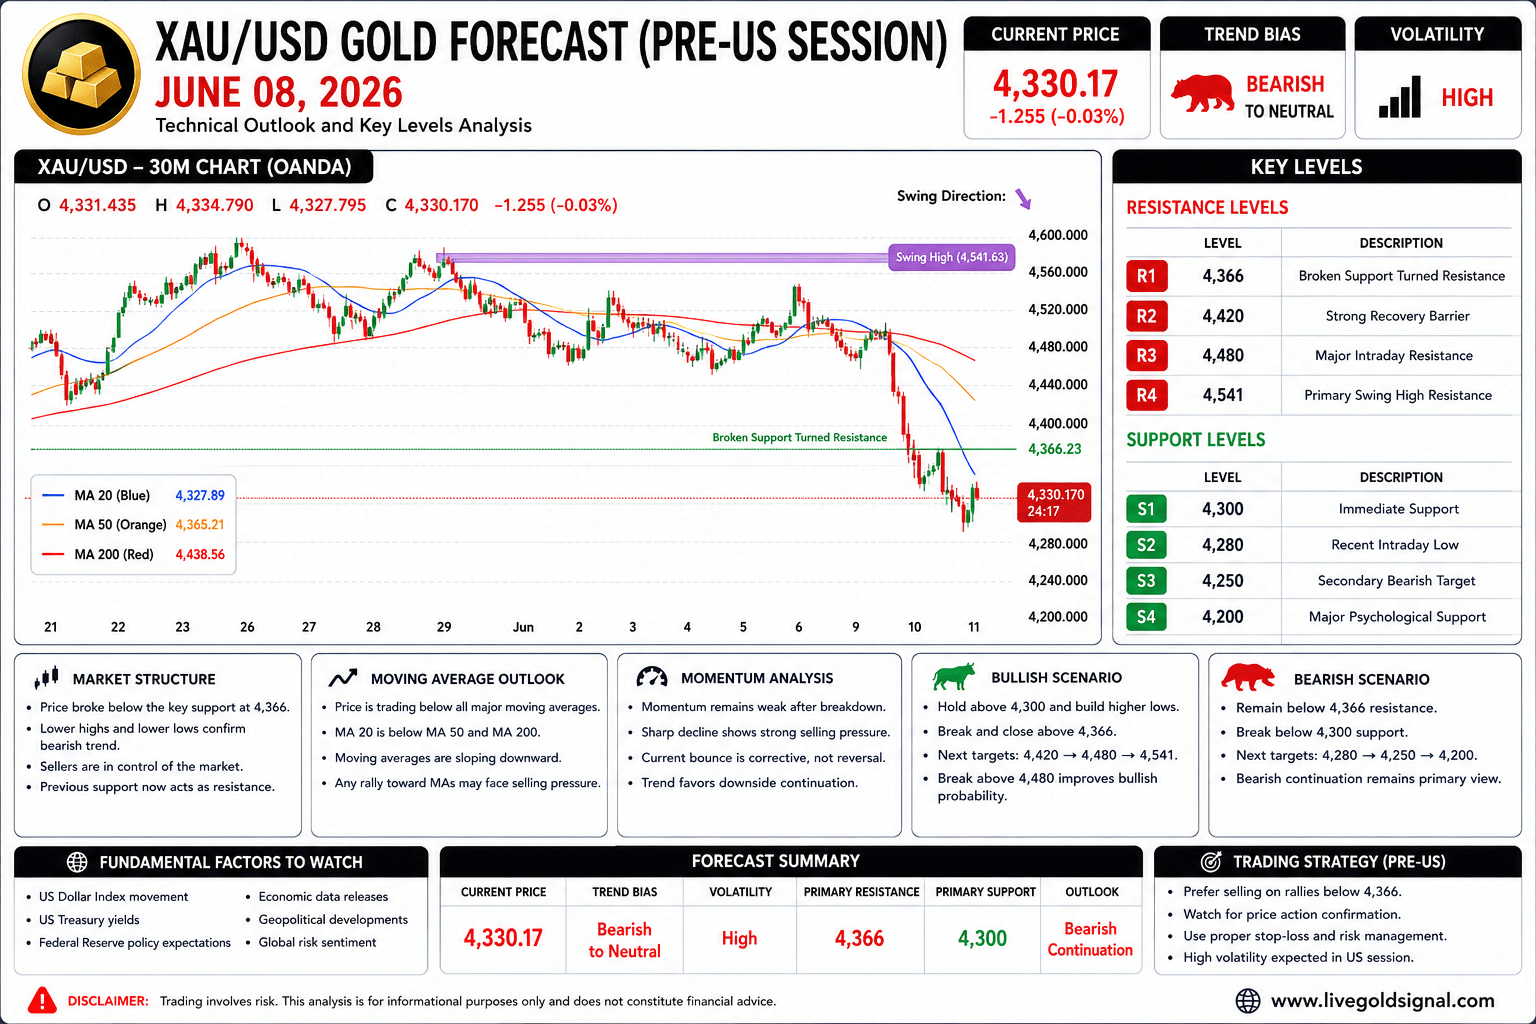
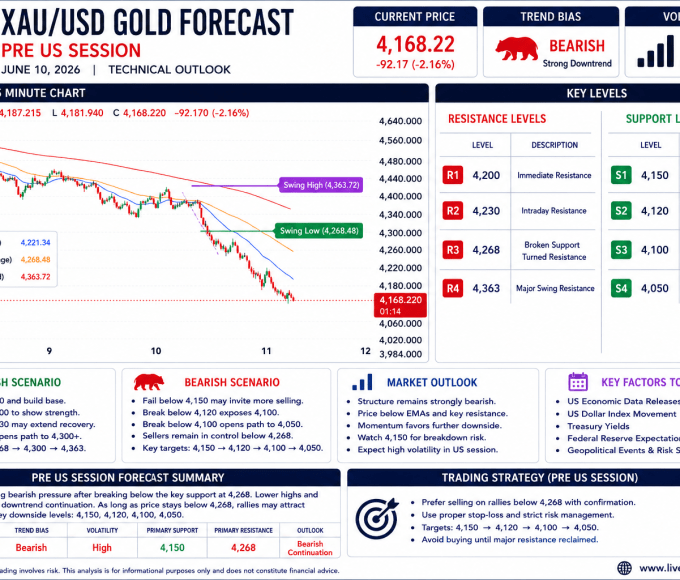
Gold (XAU/USD) enters the Pre-US session under sustained bearish pressure as sellers continue to dominate short term market structure. Based on the latest 30-minute chart, gold is currently trading near the 4,330 area after experiencing a sharp breakdown below the major support zone around 4,366. The recent selloff has significantly weakened bullish sentiment and shifted market control firmly into the hands of sellers. While a minor rebound is visible from intraday lows, the broader trend remains bearish as long as price stays below key resistance zones.
The market experienced a decisive breakdown during the previous sessions, pushing gold from the 4,500 region toward the 4,300 area in a relatively short period of time. Such aggressive declines often indicate strong institutional selling activity and usually require significant buying interest before a sustainable reversal can develop. As the US session approaches, traders are closely monitoring whether buyers can defend the current support region or whether another wave of selling pressure will emerge.
Current Market Structure
The current market structure remains clearly bearish. The most important technical development on the chart is the breakdown below the previous Swing Low area around 4,366. This zone acted as a major support region for several trading sessions and repeatedly attracted buying activity. However, once sellers successfully pushed price below this level, the market accelerated lower and confirmed a bearish continuation pattern.
From a price action perspective, gold continues to form lower highs and lower lows. This structure remains one of the strongest technical signs of an active downtrend. Every recovery attempt over the past several days has failed to produce a meaningful higher high, allowing sellers to maintain control of overall market direction.
The previous Swing High near 4,541 remains the dominant resistance level. This area marks the point where sellers aggressively entered the market and initiated the current bearish leg. Until buyers can reclaim this region, the broader market outlook is likely to remain negative.
Moving Average Analysis
Moving averages continue to support the bearish outlook. Price is trading below key short term and medium term moving averages, confirming that downward momentum remains intact. In trending markets, moving averages often serve as dynamic resistance zones, and the current setup suggests that rallies may continue to attract selling pressure.
The separation between short term and longer term moving averages also indicates strong trend momentum. When price remains consistently below these averages, traders often view pullbacks as opportunities to join the prevailing trend rather than signals of a reversal.
For sentiment to improve meaningfully, buyers would need to reclaim major moving average clusters and maintain price acceptance above them. Until that occurs, the moving average structure remains supportive of further downside movement.
Momentum And Trend Strength
Momentum remains heavily tilted toward the downside despite the recent stabilization near current levels. The speed of the previous decline demonstrates strong bearish conviction and suggests that sellers continue to possess a significant advantage.
While oversold conditions may occasionally trigger temporary rebounds, such rallies often remain corrective within broader bearish trends. Traders should therefore be cautious when interpreting short term upward movements, particularly if those moves fail to break major resistance levels.
The current momentum profile indicates that sellers remain active, and the overall trend continues to favor bearish continuation unless a major structural reversal develops.
Key Resistance Levels
| Resistance Level | Description |
|---|---|
| 4,366 | Immediate Resistance Zone |
| 4,420 | Strong Recovery Barrier |
| 4,480 | Major Intraday Resistance |
| 4,541 | Primary Swing High Resistance |
Key Support Levels
| Support Level | Description |
|---|---|
| 4,300 | Immediate Support |
| 4,280 | Recent Intraday Low |
| 4,250 | Secondary Bearish Target |
| 4,200 | Major Psychological Support |
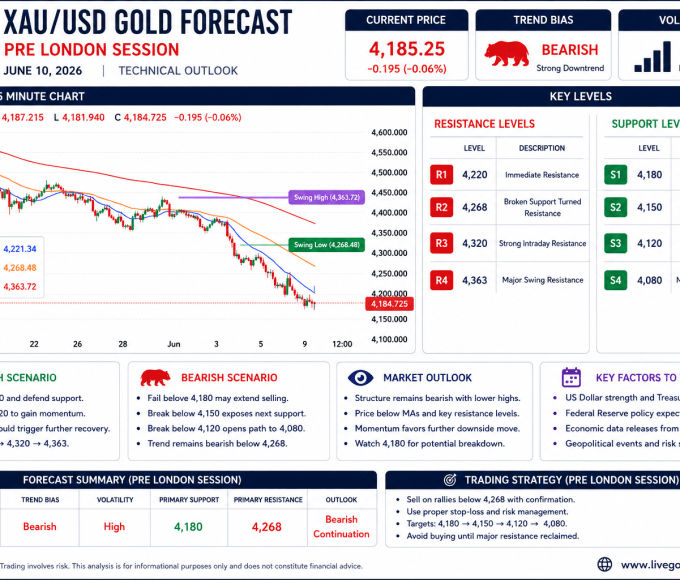
Market Sentiment Before The US Session
Heading into the US session, market sentiment remains cautious and defensive. Traders continue to favor safe positioning as gold struggles below former support zones. The inability of buyers to reclaim the broken support area suggests that confidence remains weak.
Institutional traders often pay close attention to previously broken support levels because these zones frequently become resistance after a breakdown. The current market environment reflects exactly this type of behavior, with the former support region near 4,366 now acting as a major obstacle for any recovery attempt.
As US liquidity enters the market, volatility may increase significantly. Traders should therefore prepare for potential sharp price movements around key technical levels.
Bullish Scenario
For buyers to regain control, gold must first stabilize above the 4,300 support zone and continue forming higher lows. A successful recovery above 4,366 would represent the first technical signal that selling pressure is weakening.
If buyers manage to establish acceptance above 4,366, the market could extend toward 4,420. Additional upside momentum could then expose 4,480, which represents a major resistance region. Under an exceptionally strong recovery scenario, gold could eventually challenge the primary swing resistance around 4,541.
However, this bullish scenario currently remains secondary because the broader trend structure continues to favor sellers.
Bearish Scenario
The bearish scenario remains the preferred outlook for the Pre-US session. As long as price remains below 4,366, sellers are expected to maintain control of market direction. Any corrective rally toward resistance zones may attract renewed selling pressure.
A breakdown below 4,300 would strengthen bearish momentum and expose the next support region around 4,280. If this level fails to hold, the market could extend losses toward 4,250 and potentially 4,200.
Given the current technical structure, bearish continuation remains the higher probability scenario heading into the US session.
Fundamental Factors To Watch
Several important factors could influence gold price action during the US session. Traders should closely monitor US Dollar strength, Treasury yields, Federal Reserve expectations, and major economic releases. Stronger US economic data could support the dollar and place additional pressure on gold prices.
Conversely, weaker economic figures or renewed geopolitical concerns could encourage safe haven demand and provide temporary support for gold. Market participants should also monitor broader risk sentiment across financial markets, as shifts in investor confidence can significantly impact precious metals.
Forecast Summary
| Current Bias | Trend | Volatility | Primary Support | Primary Resistance |
|---|---|---|---|---|
| Bearish | Strong Downtrend | High | 4,300 | 4,366 |
Market Outlook
The overall outlook for XAU/USD before the US session remains bearish. The decisive breakdown below the major support zone around 4,366 has shifted market control firmly toward sellers. Current price action near 4,330 indicates that bearish momentum remains active despite the recent rebound from intraday lows.
Unless buyers can reclaim 4,366 and maintain acceptance above that level, rallies are likely to be viewed as selling opportunities. The downside targets remain 4,300, 4,280, 4,250, and potentially 4,200 if bearish pressure intensifies.
Traders should continue to prioritize risk management and wait for confirmation around key technical levels before entering positions. Based on the current chart structure, moving average alignment, and momentum profile, the path of least resistance continues to point lower as the market prepares for the US trading session.