
Gold (XAU/USD) remains under strong bearish pressure ahead of the UK session as sellers continue to dominate the overall market structure. Based on the latest 15-minute chart, gold is currently trading near 4,078 after suffering an aggressive multi-session decline from the previous swing structure. Although a modest rebound has appeared during the Asian session, the recovery remains limited and does not yet change the broader bearish outlook.
The chart clearly shows that gold broke decisively below the previous Swing Low around 4,268, which acted as a major support zone earlier in the week. Once that support collapsed, selling momentum accelerated significantly and pushed price toward the psychological 4,000 region. While buyers have managed to generate a temporary bounce from recent lows, the market remains well below all major resistance levels, suggesting that sellers still maintain overall control heading into the European trading hours.
Current Market Structure
The current market structure remains firmly bearish. The most important technical development on the chart is the clean breakdown below the former support level near 4,268. This level previously served as a major liquidity area where buyers repeatedly entered the market. However, the latest decline confirms that sellers successfully absorbed demand and forced a bearish continuation move.
Price action continues to form lower highs and lower lows, which is the textbook definition of a bearish trend. Every recovery attempt during the last several sessions has been followed by renewed selling pressure, indicating that market participants continue to use rallies as selling opportunities rather than buying opportunities.
The recent rebound from below 4,000 should currently be viewed as a corrective movement inside a broader downtrend unless buyers can reclaim several key resistance zones. Until that happens, the dominant market structure remains bearish.
EMA Trend Analysis
The Exponential Moving Average structure strongly supports the bearish outlook. Short-term EMAs remain below medium-term EMAs, while medium-term EMAs remain below long-term averages. This bearish alignment confirms that downside momentum continues to dominate the market.
During strong downtrends, price often experiences temporary rebounds toward the EMA cluster before sellers re-enter the market. The current recovery appears consistent with that behavior. Unless gold can establish sustained trading above key EMA resistance zones, the trend remains vulnerable to another downside wave.
Traders should closely monitor how price reacts near dynamic EMA resistance during the UK session. Rejection from these areas could provide additional confirmation that sellers remain in control.
Momentum Analysis
Momentum remains predominantly bearish despite the recent recovery. The sharp decline from the 4,268 breakdown zone demonstrates strong institutional participation on the sell side. Such aggressive moves rarely reverse immediately without a period of consolidation and accumulation.
The latest rebound appears relatively small compared to the magnitude of the preceding decline. This suggests that buyers are currently attempting to stabilize price rather than launching a full trend reversal. Momentum indicators would likely remain below bullish thresholds while price trades beneath major resistance levels.
As long as momentum remains weak, downside continuation remains the higher probability scenario.
Liquidity Zones And Market Behavior
The former Swing Low near 4,268 now becomes the most significant resistance zone on the chart. Markets frequently revisit broken support levels before continuing the dominant trend. Therefore, any recovery toward this region should be monitored carefully.
The Swing High around 4,364 remains the major bearish invalidation level. A move back above that area would indicate that buyers are regaining control and that the current bearish structure is weakening.
On the downside, the psychological 4,000 region remains extremely important. Institutional traders often monitor round-number levels because they tend to attract large concentrations of orders. If sellers regain momentum below current levels, this area may become the next major battleground.
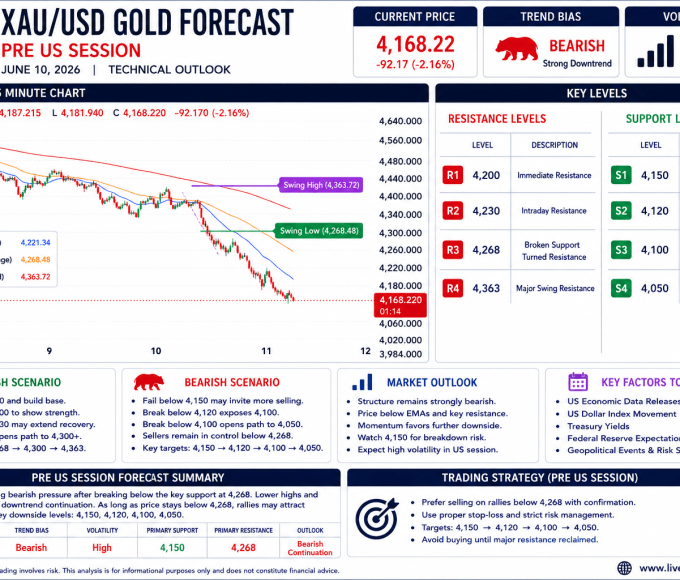
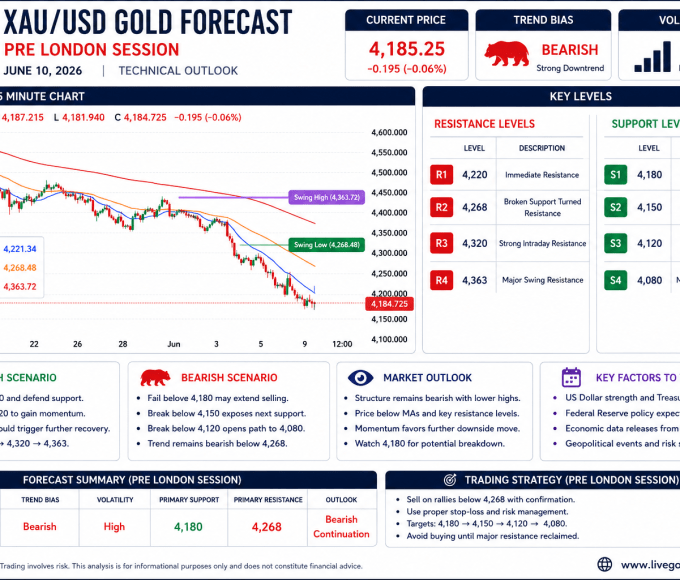
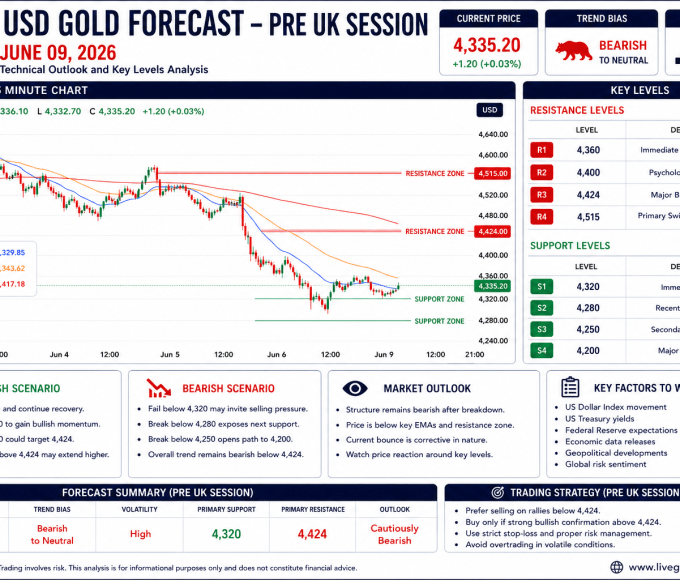
Key Resistance Levels
| Resistance Level | Description |
|---|---|
| 4,105 | Immediate Resistance |
| 4,180 | Intraday Resistance |
| 4,268 | Major Broken Support |
| 4,364 | Major Swing Resistance |
Key Support Levels
| Support Level | Description |
|---|---|
| 4,050 | Immediate Support |
| 4,000 | Psychological Support |
| 3,950 | Secondary Support |
| 3,900 | Major Downside Target |
Bullish Scenario
For buyers to gain momentum during the UK session, gold must first maintain stability above 4,050 and continue building higher lows. A break above 4,105 would provide the first indication that bullish momentum is improving.
If buyers successfully push price above 4,180, the market could target the major resistance zone near 4,268. This area represents the most important bullish objective because reclaiming it would significantly improve market sentiment.
Further bullish continuation could then expose the Swing High region near 4,364. However, considering the current bearish structure, this scenario remains secondary unless significant buying pressure emerges during the European session.
Bearish Scenario
The bearish scenario remains the primary forecast for today. As long as price remains below 4,180 and particularly below 4,268, sellers continue to hold the technical advantage.
Any recovery toward resistance zones may attract fresh selling interest from institutional participants looking to trade in the direction of the dominant trend. Failure near resistance could trigger another wave of downside momentum.
If gold falls below 4,050, sellers may attempt another test of the 4,000 psychological level. A decisive break below 4,000 could open the path toward 3,950 and potentially 3,900 during upcoming sessions.
Fundamental Drivers To Watch
Several macroeconomic factors could influence gold volatility during the UK session. Traders should monitor US Dollar strength, Treasury yields, central bank commentary, inflation expectations, and geopolitical developments.
A stronger US Dollar generally creates downward pressure on gold prices because gold becomes more expensive for holders of other currencies. Rising bond yields can also reduce gold’s attractiveness by increasing the opportunity cost of holding non-yielding assets.
Unexpected geopolitical headlines or weaker-than-expected economic data could provide temporary support for gold through safe-haven demand. Nevertheless, technical structure currently remains the dominant driver.
Pre UK Session Outlook
Ahead of the UK session, gold remains locked inside a broader bearish trend despite the recent rebound from session lows. The breakdown below 4,268 continues to define market sentiment, while the recovery toward 4,078 appears corrective rather than impulsive.
Traders should focus on the 4,105 and 4,180 resistance zones during the upcoming session. Failure to break these levels would likely reinforce bearish continuation expectations. On the downside, 4,050 and 4,000 remain the most important support levels to monitor.
Overall, the path of least resistance remains lower. Unless buyers reclaim major resistance levels and significantly improve market structure, rallies are likely to be viewed as temporary corrections within the broader bearish trend. Therefore, the primary forecast for the Pre UK Session remains bearish with downside risks continuing to dominate the market outlook.