
Gold (XAU/USD) continues to trade within a recovery phase after experiencing one of the strongest bearish declines seen during the past several trading sessions. According to the latest 15-minute chart, gold is currently trading around the 4,200 region after successfully bouncing from the recent swing low near 4,023. The market has managed to recover a portion of its previous losses, but the broader technical structure remains bearish as price continues to trade significantly below the major swing high located around 4,363.
During the previous sessions, aggressive selling pressure pushed gold sharply lower and created a series of lower highs and lower lows. However, buyers finally appeared near the 4,023 support region, generating a strong rebound toward the 4,200 area. This recovery has improved short term sentiment, but from a broader technical perspective the market has not yet confirmed a complete trend reversal.
As the UK session approaches, traders are closely monitoring whether the current recovery can extend toward higher resistance zones or whether sellers will regain control and continue the dominant bearish trend. The answer will likely depend on how price reacts around key resistance levels during the first half of the European trading session.
Market Structure Analysis
The current market structure shows two different stories depending on the timeframe being analyzed. On the short term intraday chart, buyers have gained momentum following the strong rebound from 4,023. This has created a temporary bullish structure consisting of higher lows and higher highs over the most recent price swings.
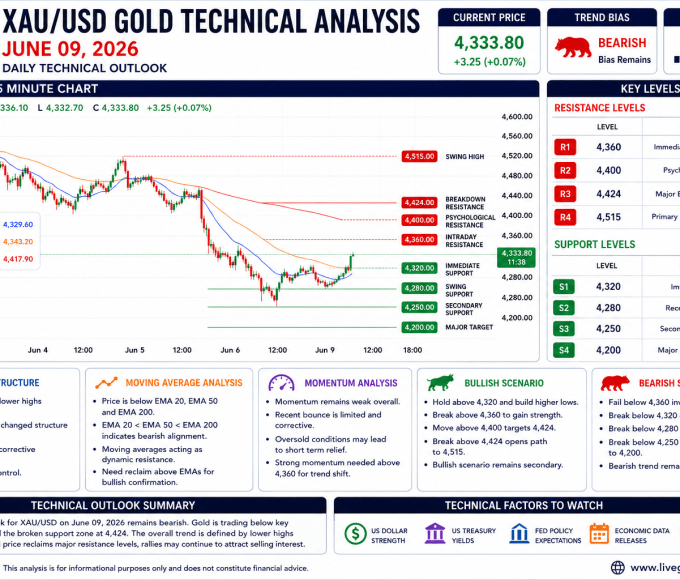
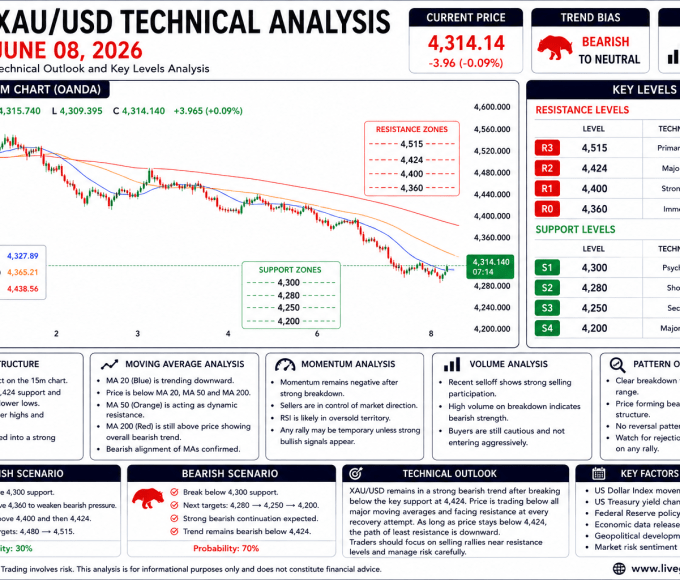
However, when viewed from a broader perspective, the overall market remains bearish. The previous breakdown from above 4,300 triggered a substantial decline that completely changed market sentiment. Although the recent recovery is encouraging for buyers, price still remains well below the major swing high near 4,363 and considerably below the previous breakdown zones.
For a true bullish reversal to develop, buyers must continue creating higher highs while reclaiming several key resistance areas. Until that occurs, the current recovery should still be viewed as a corrective bounce within a larger bearish trend.
Moving Average Analysis
Moving averages are beginning to show early signs of stabilization after several sessions of aggressive selling pressure. The recent rally from 4,023 has allowed short term moving averages to flatten and gradually turn upward.
The 20-period EMA is expected to remain above current short term support levels and continues acting as a dynamic guide for intraday buyers. As long as price remains above this average, bullish momentum could remain active during the UK session.
The 50-period EMA remains an important technical barrier. A sustained move above this moving average would strengthen the bullish recovery and improve the probability of additional upside movement toward higher resistance zones.
Meanwhile, the longer term EMA structure remains bearish because the market continues trading below major trend-defining moving averages. This indicates that while short term buying pressure has emerged, the longer term trend remains vulnerable to renewed selling activity.
Momentum Analysis
Momentum conditions have improved considerably since the formation of the recent swing low. The rebound from 4,023 occurred with strong bullish participation and suggests that buyers are actively defending this support region.
The speed of the recovery indicates that some short sellers may have begun taking profits while new buyers entered the market. This combination often creates strong countertrend rallies capable of extending further than many traders initially expect.
Despite the improvement in momentum, traders should remember that bullish momentum remains in its early stages. Significant resistance levels remain overhead, and these areas could attract fresh selling pressure if buyers fail to maintain current strength.
Therefore, momentum currently favors short term upside continuation, but confirmation from additional price action remains necessary before declaring a complete trend reversal.
Support Zone Analysis
The most important support level on the chart remains the recent swing low near 4,023. This area represents the foundation of the current recovery and will likely determine whether buyers can maintain control during the upcoming session.
A successful defense of this support zone would reinforce bullish sentiment and encourage additional upside movement. Conversely, a breakdown below 4,023 would invalidate much of the recent recovery and potentially restart the broader bearish trend.
Additional support levels can be found around 4,080 and 4,120. These zones may provide temporary buying interest if intraday pullbacks occur before the market attempts another move higher.
Resistance Zone Analysis
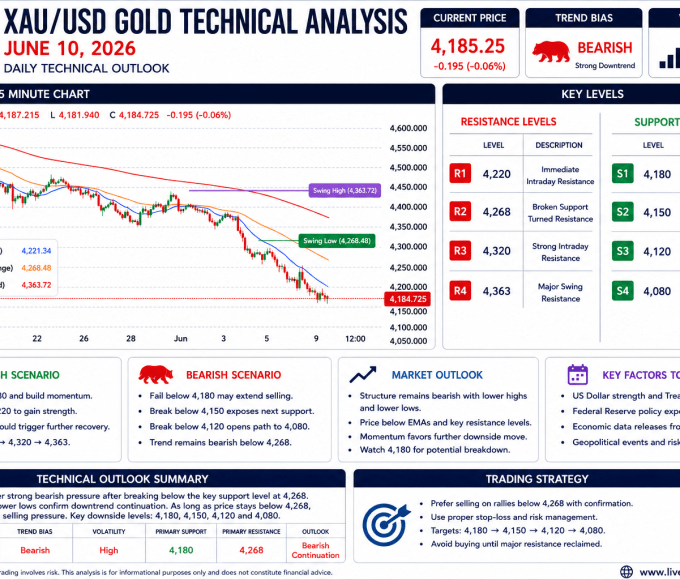
The first important resistance area appears near 4,220 where sellers may attempt to slow the current recovery. A decisive break above this region would improve bullish confidence and increase the probability of further gains.
Beyond that, the next major resistance can be found near 4,268 which corresponds closely with the previously identified swing low level. Since broken support often becomes resistance, this zone could attract substantial selling pressure.
The strongest resistance remains the major swing high around 4,363. This level represents the dominant bearish structure and serves as the primary obstacle preventing a full trend reversal.
Only a decisive break above 4,363 would significantly alter the broader technical outlook and shift long term momentum back toward buyers.
Key Resistance Levels
| Resistance Level | Description |
|---|---|
| 4,220 | Immediate Resistance |
| 4,268 | Major Structural Resistance |
| 4,300 | Psychological Barrier |
| 4,363 | Major Swing High Resistance |
Key Support Levels
| Support Level | Description |
|---|---|
| 4,120 | Immediate Support |
| 4,080 | Secondary Support |
| 4,023 | Primary Swing Low Support |
| 4,000 | Psychological Support |
Bullish Scenario
The bullish scenario remains active as long as gold continues holding above the 4,120 support area. Buyers have already demonstrated their willingness to defend lower prices near 4,023 and could attempt another upward expansion during the UK session.
If price successfully breaks above 4,220, bullish momentum may accelerate toward 4,268. A sustained move above 4,268 would create a significantly stronger technical outlook and potentially open the path toward 4,300 and eventually 4,363.
Such a move would confirm that the recent recovery is developing into a broader trend reversal rather than remaining merely a corrective bounce.
Bearish Scenario
The bearish scenario remains relevant because the broader trend continues pointing lower. Sellers may use the current recovery as an opportunity to re-enter positions at more attractive levels.
Failure near 4,220 or 4,268 could trigger renewed downside pressure. If price falls below 4,120, sellers may target 4,080 and eventually retest the major swing low near 4,023.
A breakdown below 4,023 would represent a major bearish continuation signal and could expose the psychological 4,000 level during future sessions.
Technical Outlook Summary
For the Pre UK Session on June 13, 2026, gold is showing encouraging recovery signs after rebounding from the major swing low near 4,023. Short term momentum currently favors buyers, while moving averages are beginning to stabilize following the previous decline.
However, the broader technical structure remains bearish until price can reclaim higher resistance zones, particularly 4,268 and 4,363. Traders should monitor how price behaves around these levels because they are likely to determine the next major directional move.
The overall technical bias can be described as cautiously bullish in the short term but still bearish from a broader trend perspective. As long as support near 4,023 remains intact, recovery potential exists. Nevertheless, sellers continue to hold the larger structural advantage until key resistance barriers are decisively broken.