Technical Overview
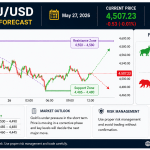
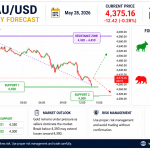
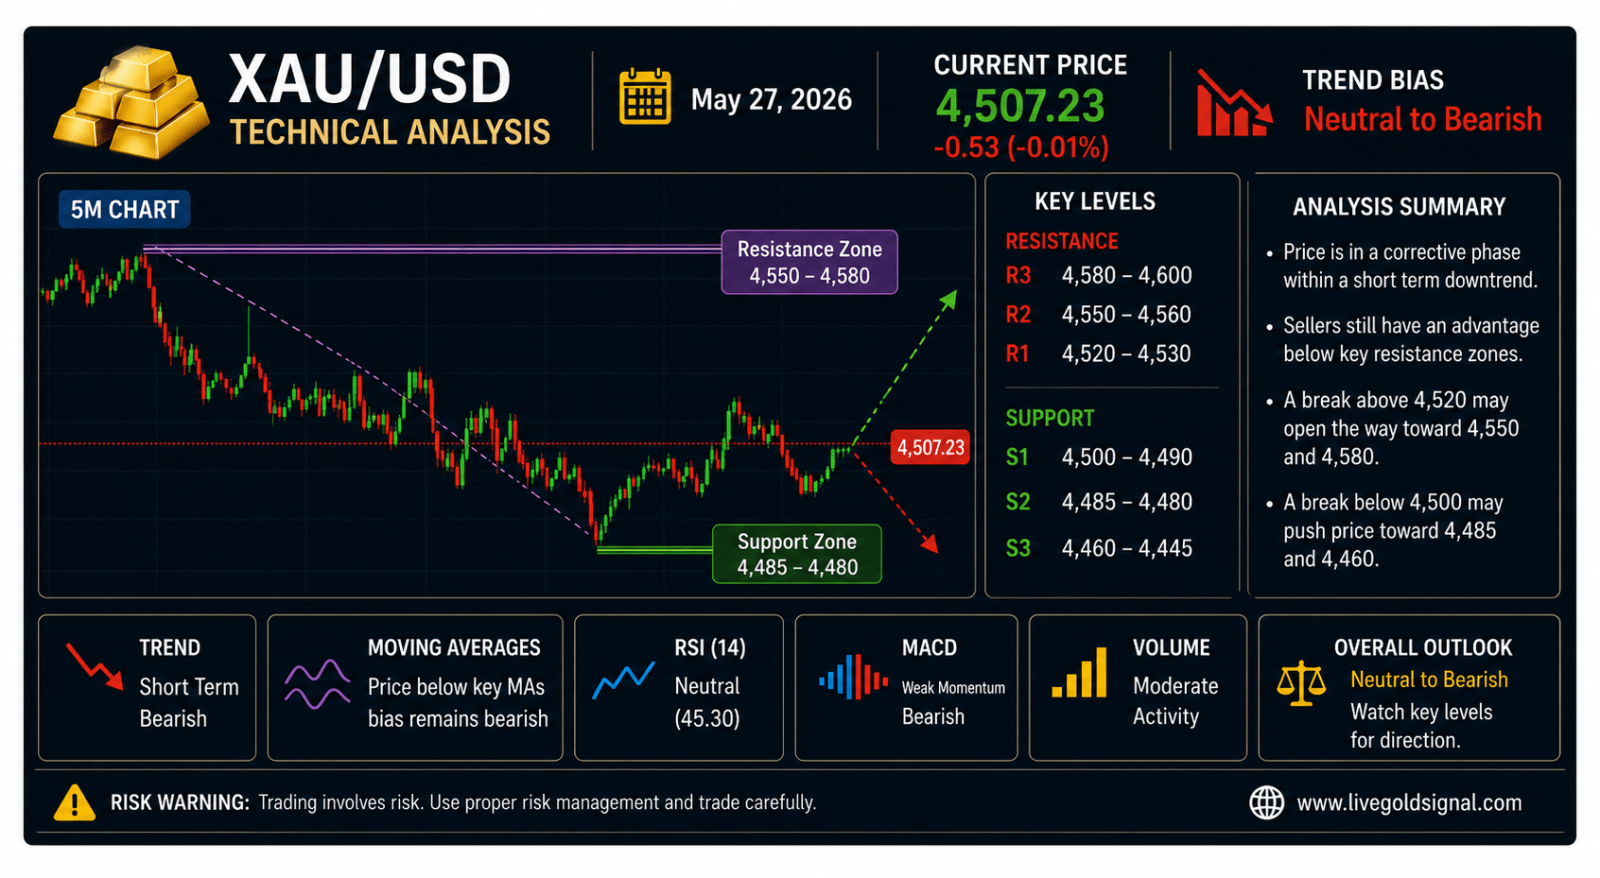
Gold (XAU/USD) continues trading in a highly sensitive technical environment as market participants evaluate the latest price structure and attempt to identify the next directional move. According to the latest chart structure, the market recently experienced strong bearish pressure after failing to maintain momentum above previous swing highs. Sellers regained control after the rejection, pushing price lower before buyers attempted to create temporary stabilization around key support areas.
The current chart suggests that Gold remains under pressure in the short term despite intermittent recovery attempts. Price action indicates that sellers continue defending upper resistance zones while buyers are trying to establish a stable foundation around support regions. The battle between these two groups is creating volatile movement and increasing the probability of sudden intraday price swings.
From a broader perspective, the market is showing characteristics of a corrective phase within a larger trend structure. Traders are closely watching whether the recent downside movement will extend further or if buyers will gradually regain strength and initiate a stronger recovery.
Market Structure Analysis
Examining the latest price action reveals a clear sequence of lower highs and lower lows following the previous rejection from upper levels. Such a structure often reflects bearish dominance because sellers continue entering the market at progressively lower prices.
However, during the latest movement, downside momentum has shown signs of moderation. While price remains under pressure, aggressive selling activity appears weaker than during the earlier decline phase. This suggests that sellers may be experiencing temporary exhaustion. The market currently sits within a transition area where trend continuation and corrective recovery both remain possible outcomes. Traders generally wait for stronger confirmation signals before making assumptions regarding the next significant movement.
Support And Resistance Levels
| Technical Level | Price Area | Analysis |
|---|---|---|
| Support 1 | 4500–4490 | Immediate buyer zone |
| Support 2 | 4485–4480 | Strong support region |
| Support 3 | 4460–4445 | Extended downside target |
| Resistance 1 | 4525–4535 | Initial selling pressure |
| Resistance 2 | 4550–4560 | Major resistance zone |
| Resistance 3 | 4580–4600 | Strong supply area |
Trend Direction Analysis
Current trend behavior continues favoring a mildly bearish outlook because price remains below important resistance regions and recent highs continue appearing lower than previous highs. Trend analysis becomes important because it helps traders avoid trading against dominant market direction. At the moment, short term trend conditions indicate caution regarding aggressive bullish expectations. Unless buyers successfully break major resistance and maintain price above those levels, the broader technical picture may continue favoring downside pressure.
Moving Average Analysis
Moving averages currently suggest weakening upside momentum. Short term averages are flattening while longer averages continue indicating moderate bearish pressure. Price movements around moving averages frequently create temporary support and resistance reactions. Therefore traders often monitor these indicators closely when attempting to identify trend continuation or reversal opportunities.
RSI Analysis
The Relative Strength Index currently remains near neutral territory. This indicates that market conditions are not strongly overbought or oversold. When RSI remains near middle zones, price often enters consolidation phases before stronger directional movement develops.
MACD Analysis
MACD behavior currently reflects weakening bearish momentum compared with earlier sessions. Histogram movement suggests that selling pressure may be slowing temporarily. However, temporary momentum reduction alone does not necessarily indicate a confirmed trend reversal. Additional confirmation through price action remains important.
Volume Analysis
Volume activity suggests market participants remain cautious near current levels. Increased volume during breakouts usually strengthens movement reliability, while weaker volume can increase false breakout risks. Current volume conditions imply traders are waiting for stronger directional confirmation before increasing market participation.
Technical Outlook
Overall technical conditions currently suggest a neutral to bearish outlook for Gold. While sellers continue holding an advantage, downside momentum has weakened compared with earlier sessions. If price successfully breaks above immediate resistance zones, recovery momentum could strengthen and create additional upside opportunities. Conversely, failure near resistance combined with renewed selling pressure may expose lower support regions again. For now, traders should continue monitoring reaction near key support and resistance levels because these areas are likely to determine the next meaningful movement in Gold prices.