
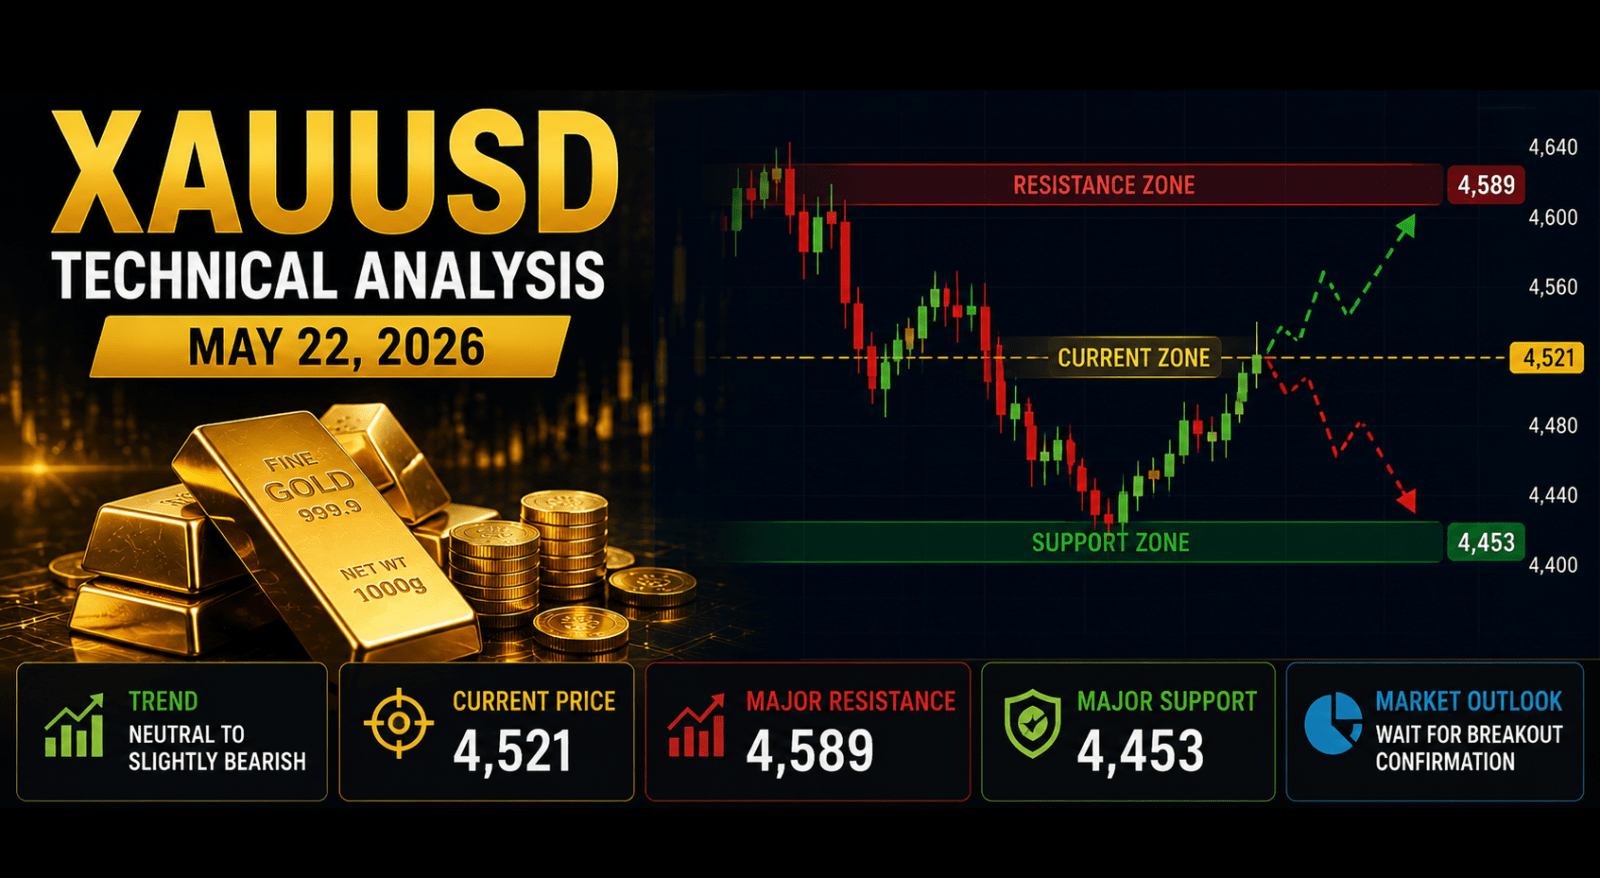
Gold continues trading inside a highly active and volatile structure during today’s market session as buyers and sellers remain involved in a significant battle for directional control. Based on the latest chart structure and recent price movement, XAUUSD is currently moving around the 4,520 area after experiencing repeated fluctuations across multiple intraday sessions. The market currently shows signs of uncertainty because price remains trapped between major support and resistance structures without confirming a stronger breakout direction.
During recent sessions Gold experienced substantial downside pressure after failing to maintain bullish momentum near previous highs. The market then entered a corrective movement where price repeatedly moved between support and resistance regions. Such behavior frequently appears before stronger trend continuation develops. Traders often observe these conditions carefully because consolidation phases frequently act as preparation periods before larger movements occur.
The latest chart structure suggests that market participants remain highly sensitive toward price fluctuations. Repeated rejection candles and aggressive short-term movement indicate that both institutional traders and retail participants continue reacting strongly near key levels. The market currently remains technically important because price is positioned close to major decision zones.
From a structural perspective, the recent market created a major swing high around 4,589. Following this movement, selling pressure increased significantly and pushed price toward the important support area near 4,453. The existence of these two important levels creates a broader trading range where price currently continues consolidating.
When price repeatedly moves between upper resistance and lower support areas without creating stronger continuation, technical traders often classify such conditions as a consolidation environment. During these situations buyers attempt defending lower regions while sellers attempt controlling higher levels.
Current price movement indicates that Gold remains below recent resistance structures. This condition suggests that buyers still require additional momentum before stronger upside continuation becomes possible. The inability of price to establish sustained movement above resistance frequently creates additional bearish pressure because sellers often interpret such behavior as weakness.
Looking deeper into market structure, multiple candles visible across recent movement suggest repeated rejection near higher prices. Rejection patterns frequently indicate the existence of active supply regions where market participants continue taking profit or initiating fresh selling positions.
Meanwhile, lower regions near support continue attracting buying activity. Buyers repeatedly entering the market around these zones suggest that some participants currently consider lower prices attractive entry opportunities. This repeated support reaction currently prevents stronger downside continuation.
Short Term Trend Structure
The short-term market trend currently appears relatively neutral with a slight bearish tendency. Although price recently attempted moderate recovery movement, the broader chart still shows lower highs developing over multiple sessions. Lower highs frequently suggest that sellers continue maintaining partial market control.
Price movement also indicates that volatility remains elevated. Intraday candles continue showing rapid expansion and contraction behavior. Such movement generally creates both opportunity and risk because sudden directional changes frequently occur without significant warning.
The latest chart also demonstrates that momentum currently remains unstable. Buyers successfully created temporary rebounds during recent sessions, though these movements have not yet transformed into stronger trend continuation.
Resistance Structure Analysis
The strongest immediate resistance currently remains positioned around the 4,589 region. This level previously attracted substantial selling activity and prevented continuation toward higher prices. Traders frequently monitor such areas because previous rejection regions often continue influencing future market behavior.
If buyers eventually establish stronger momentum and successfully break above this region, additional upside continuation may become possible. Momentum traders often enter markets after confirmed breakouts because stronger movement frequently follows successful resistance violations.
Support Structure Analysis
Major support currently exists near 4,453. This region remains important because buyers previously entered aggressively around this area and successfully prevented larger downside movement.
Failure of this support could significantly weaken bullish sentiment because additional selling activity frequently emerges after important support structures collapse.
| Technical Zone | Price Level | Technical Meaning |
| Major Resistance | 4,589 | Strong selling pressure area |
| Current Trading Zone | 4,520–4,540 | High volatility consolidation area |
| Major Structural Support | 4,453 | Buyer reaction zone |
| Extended Support | 4,420 | Potential downside target |
Technical Outlook For Today’s Session
Overall technical conditions suggest that Gold currently remains inside a highly sensitive trading environment where stronger movement has not yet been confirmed. Price still trades between major support and resistance structures while volatility remains elevated. Buyers continue attempting recovery while sellers maintain pressure near upper regions. Until a confirmed breakout develops, traders should continue expecting rapid movement and increased market fluctuations during today’s trading session.
From an overall technical perspective, the broader structure currently favors cautious trading behavior because false breakouts frequently appear during consolidation environments. Traders watching current market conditions will likely focus heavily on support and resistance reactions before stronger directional decisions emerge.

