
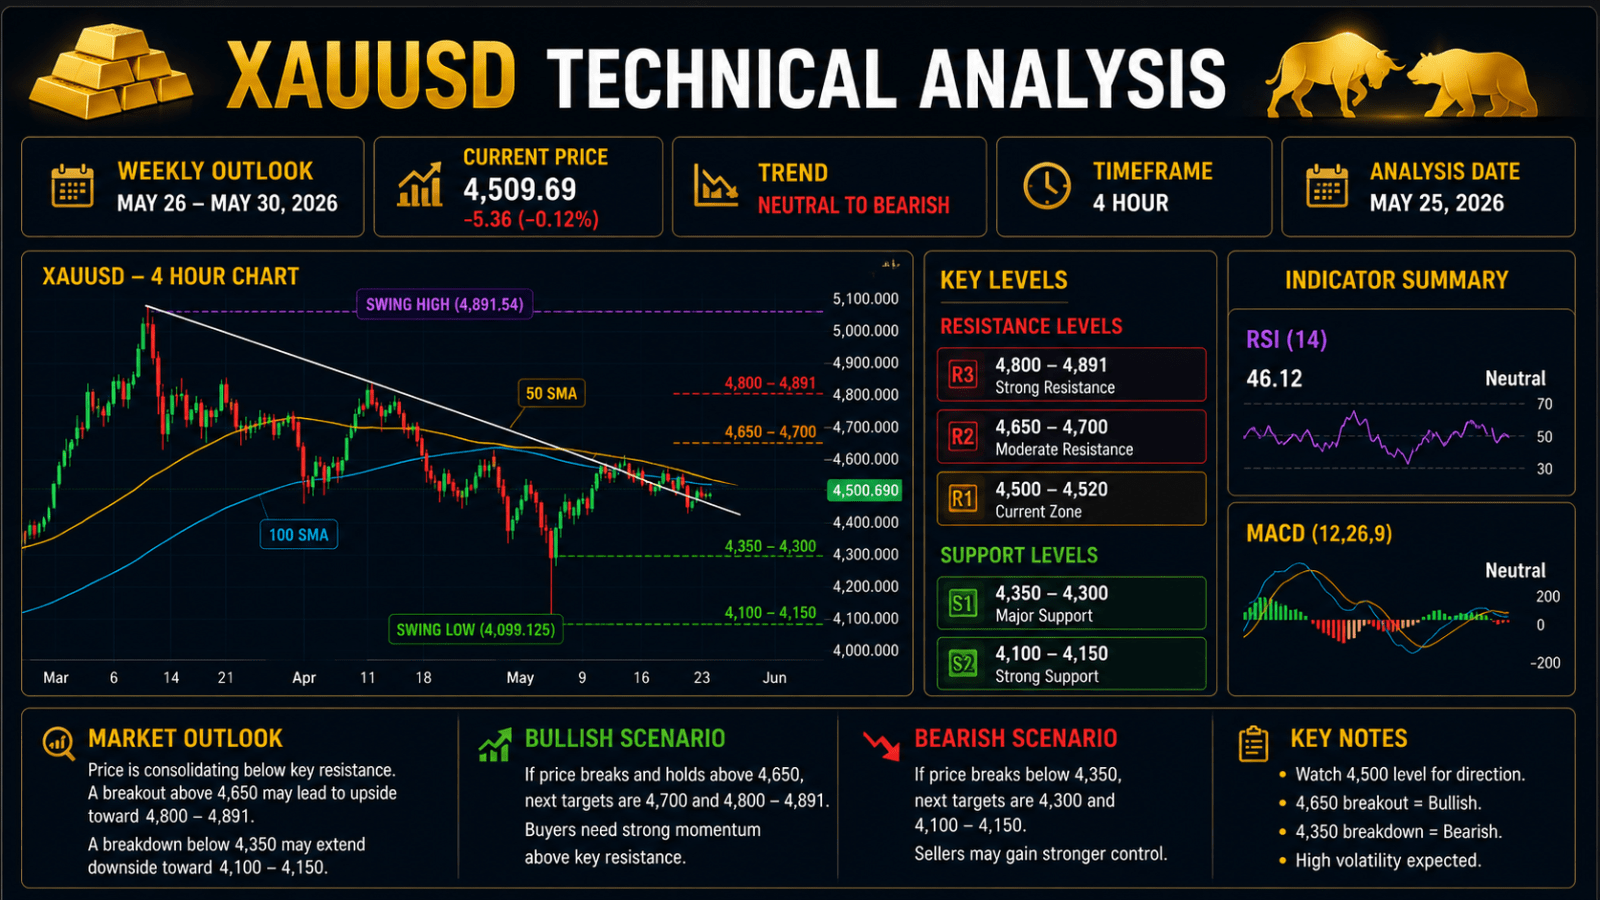
Gold begins the new trading week at a highly sensitive technical level after spending recent sessions under continuous pressure from sellers. Based on the latest higher timeframe structure from the chart you shared, XAUUSD is moving around the 4,500 region while price continues trading beneath an important swing high area. The overall market structure currently shows hesitation and consolidation, though broader price behavior still indicates that sellers maintain stronger control over momentum.
The coming week may become important because Gold has reached an area where both bullish and bearish scenarios remain active. Buyers continue defending nearby support levels while sellers repeatedly block upward recovery attempts. This situation generally creates larger market movement later because price cannot remain trapped inside a narrow structure indefinitely.
When looking at the broader chart structure, Gold experienced a substantial decline from previous highs and then entered a period of sideways movement. Following large directional movement, markets frequently move into consolidation before deciding the next major trend.
The recent structure suggests that XAUUSD is now approaching such a decision phase.
Current Trend Structure Analysis
The first important observation from the chart is that Gold continues creating lower highs compared with previous swings. Lower highs generally indicate that bullish momentum has weakened because buyers are unable to push prices toward stronger highs.
Recent recovery attempts encountered resistance before establishing sustained upward continuation. Sellers repeatedly entered near resistance zones and pushed price lower.
This behavior often appears during bearish structures where market sentiment gradually shifts away from aggressive buying.
However, one additional factor requires attention. Despite downward pressure, buyers continue protecting major support regions. This means bears remain active but currently lack complete control over the market.
Support Zone Analysis
Support zones represent areas where buyers previously entered aggressively. Based on the latest chart structure, the major support area appears around the 4,100–4,150 region.
Price reacted strongly from this area in earlier sessions and produced notable recovery movement. Such reactions often indicate institutional participation because larger market players frequently accumulate positions around strong support structures.
If Gold revisits this support area during the upcoming week, traders may closely monitor price behavior for potential reaction signals.
A successful defense could encourage recovery movement while a confirmed breakdown may trigger additional selling pressure.
Resistance Zone Analysis
Resistance areas continue acting as the main challenge for buyers. The latest chart highlights stronger resistance near the 4,800–4,891 region.
This area previously rejected price movement and created significant downward pressure. Multiple rejection movements generally strengthen resistance because traders increasingly recognize the area as an important supply zone.
Until buyers establish stronger momentum above this region, broader market sentiment may remain cautious.
| Technical Level | Price Area | Importance |
| Major Resistance | 4,800–4,891 | Heavy selling zone |
| Current Zone | 4,500–4,520 | Decision area |
| Major Support | 4,100–4,150 | Buyer accumulation zone |
Moving Average Analysis
Moving averages remain useful for identifying broader trend direction. Current chart behavior suggests Gold continues trading beneath key dynamic resistance structures. Price remaining below major moving averages frequently reflects bearish sentiment because buyers struggle to regain momentum.
If Gold successfully moves above important moving average levels during the coming sessions, sentiment could gradually improve.
However, continued failure below moving averages would strengthen the current bearish structure.
Momentum Indicator Analysis
Momentum indicators currently suggest mixed signals. Earlier selling momentum appears weaker compared with previous sessions, though stronger bullish confirmation remains absent.
RSI behavior indicates that selling pressure has moderated slightly, while price action itself continues showing hesitation.
MACD conditions also suggest that bearish momentum has slowed but not completely disappeared.
This combination often appears before larger directional movement develops.
Volume Behavior Analysis
Trading volume also plays an important role in understanding market participation. Large volume movement during breakouts frequently confirms trend continuation.
Recent price movement appears relatively controlled without extreme volume expansion, suggesting that stronger conviction from institutional traders may still be developing.
Volume expansion during the coming week may therefore become an important confirmation signal.
Bullish Technical Scenario
For bullish conditions to strengthen, buyers need to maintain current support and gradually establish higher highs. Strong movement above resistance structures could trigger additional buying activity.
If buyers regain control, Gold may attempt a recovery phase toward upper resistance zones.
Improved sentiment toward risk assets and weaker Dollar performance could further support this scenario.
Bearish Technical Scenario
The bearish outlook remains active because broader market structure still favors sellers. Lower highs continue appearing and price remains below major resistance structures.
Failure to maintain support may create renewed downside pressure and encourage additional selling activity.
Sustained movement beneath support would strengthen the probability of larger downside continuation.
Weekly Technical Analysis Conclusion
Overall, Gold enters the upcoming trading week in a critical technical position. The broader trend continues showing bearish characteristics while short-term price behavior suggests temporary stabilization.
The 4,500 region currently acts as a major decision point where traders may closely monitor market reaction. Resistance remains strong overhead while support continues protecting lower levels.
Until price establishes stronger directional confirmation, traders should expect continued volatility and two-way movement. The upcoming sessions could determine whether Gold begins a larger recovery phase or resumes its broader bearish structure.
