
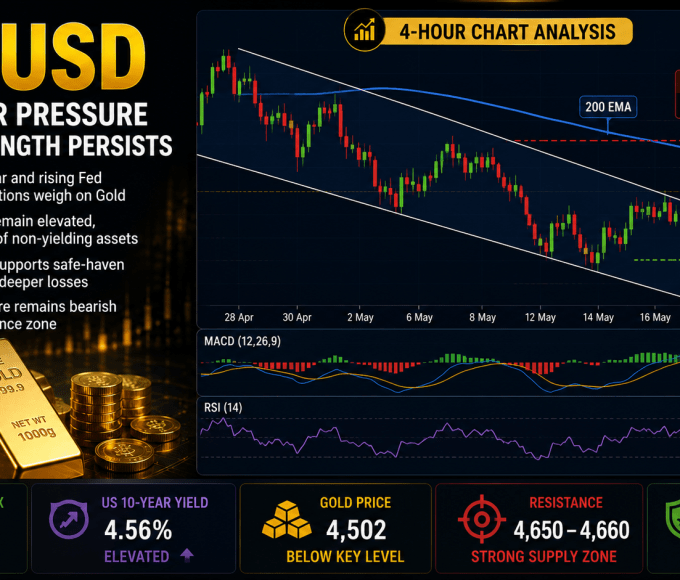
Today, April 28, 2026 — Gold markets have seen another significant decline. The XAU/USD pair has dropped to around $4,628 per ounce, marking a notable fall from last week’s levels. Many investors are puzzled: a war is raging in the Middle East, oil prices are at historic highs — so why is gold falling? This article breaks down exactly what is driving today’s gold price drop, the chain reaction behind it, and what traders and investors should watch going forward.
Gold Market Snapshot: Where Prices Stand Today
Since the US-Iran war began on February 28, 2026, gold has fallen more than 10% — a move that defies conventional wisdom. Normally, war means higher gold prices. But this time, a very specific economic chain reaction is working against the precious metal. The table below shows the current state of key markets as of April 28, 2026.
| Asset / Index | Current Price | Change |
|---|---|---|
| Gold (XAU/USD) | $4,628 / oz | ▼ Down over 2% |
| Silver (XAG/USD) | $71.67 / oz | ▼ Down 4.6% |
| Platinum | $1,914.61 / oz | ▼ Down 2.5% |
| Brent Crude Oil | $105 / barrel | ▲ Sharply Higher |
| December Fed Rate Cut Probability | 12% | ▼ Down from 25% |
| April FOMC Hold Probability | 99.5% | Near Certain |
Why Is Gold Falling During a War? The Real Explanation
The short answer is: this war triggered an oil price shock, the oil shock triggered inflation, and inflation killed the rate-cut expectations that gold needs to rally. This is the chain reaction that most financial news coverage misses — and once you understand it, today’s price action makes complete sense.
Gold is a non-yielding asset. It pays no interest or dividend. When interest rates are high and bond yields are attractive, large institutional investors sell gold and move into yield-bearing assets. The opportunity cost of holding gold becomes too high. That is exactly what is happening right now. The US-Iran conflict shut down the Strait of Hormuz — one of the world’s most critical oil shipping routes — and oil prices have surged nearly 60% since February 28. Rising oil prices feed directly into overall inflation, which forces the Federal Reserve to keep interest rates elevated. High rates make gold less attractive. Institutional money flows out. Prices fall.
The Core Driver: Real Yields Are Hurting Gold
The most important concept to understand here is “real yield” — the return on bonds after subtracting inflation expectations. Gold tracks real yields more closely than it tracks inflation alone. When energy prices drive inflation higher and simultaneously force the Fed to stay restrictive, real yields remain elevated. Elevated real yields are the single biggest enemy of gold prices.
Put simply: when a bank deposit or government bond offers you a solid, guaranteed return, there is little reason to hold an asset that pays nothing. Until real yields come down — either through falling inflation or falling interest rates — gold faces a structural headwind regardless of geopolitical events.
Trump’s Iran Policy and the Strait of Hormuz Crisis
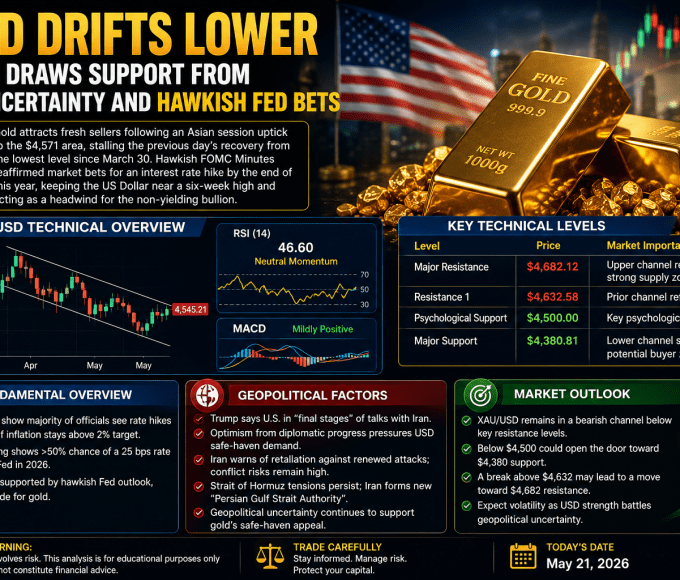
The immediate catalyst for today’s decline is the breakdown of US-Iran peace negotiations. The Trump administration cancelled a planned trip by senior envoys to Islamabad for talks with Iran over the weekend. Tehran, for its part, made clear it will not engage in any negotiations while under threat or military blockade.
Iran has, however, submitted a new proposal through Pakistani mediators. The proposal calls for extending the ceasefire, reopening the Strait of Hormuz, and deferring nuclear negotiations until after the US blockade is lifted. Whether President Trump will entertain this offer remains deeply uncertain as of today. This uncertainty is the market’s biggest problem right now.
The logical chain is straightforward: Strait of Hormuz closed → oil supply disrupted → energy prices elevated → inflation persists → central banks cannot cut rates → gold remains under pressure. Every stage of this chain is currently active and reinforcing the next.
The Federal Reserve Meeting: This Week’s Biggest Event
Today and tomorrow (April 28–29, 2026), the US Federal Reserve holds its Federal Open Market Committee (FOMC) meeting. This is widely expected to be Fed Chair Jerome Powell’s final meeting, as Kevin Warsh has been named as his likely successor. The CME FedWatch tool shows a 99.5% probability that rates will remain unchanged at 3.50–3.75%.
What matters most for gold is not whether rates are held, but what signals Powell sends at his final press conference. If he hints at future rate cuts — even cautiously — gold could rally sharply. If his tone is hawkish and emphasizes ongoing inflation risk, the downward pressure on gold is likely to continue. Markets will parse every word carefully.
| Date | Event | Market Impact |
|---|---|---|
| April 28–29 | FOMC Interest Rate Decision (Powell’s Final Meeting) | Very High |
| April 30 | US Q1 2026 GDP Data Release | High |
| April 30 | Weekly Initial Jobless Claims | Moderate |
| May 1 | April Manufacturing PMI Release | Moderate |
| This Week | Bank of England, ECB, Bank of Japan Policy Decisions | High |
Gold’s Price Timeline: From War Outbreak to Today
To understand where gold stands today, it helps to trace the price action since the conflict began. Gold’s initial reaction to the outbreak of war was a brief rally — the classic safe-haven response. But that rally failed to hold as the economic consequences of the oil shock became clear.
| Period | XAU/USD Price | Key Event |
|---|---|---|
| February 28 (War Begins) | ~$5,296 | US-Iran war outbreak, Strait of Hormuz closed |
| First Week of March | $5,423 (Peak) | Safe-haven demand drives brief rally |
| March (FOMC Hold) | ~$4,900–$5,000 | Fed holds rates; oil inflation fears rise |
| April 1–2 | $4,664 | Trump threatens Iran escalation in prime-time address |
| April 28 (Today) | ~$4,628 | Peace talks collapse; FOMC meeting begins |
Oil’s Role: The Invisible Hand Pushing Gold Down
The Strait of Hormuz carries approximately 20–25% of the world’s daily oil supply. With this route effectively shut down since late February, Brent crude has surged to $105 per barrel. The International Energy Agency (IEA) has described this as one of the largest energy supply shocks on record.
The economic ripple effects are wide. Higher oil prices push up transportation costs, manufacturing costs, and the price of almost every consumer good. This feeds directly into CPI inflation figures. Central banks — including the Federal Reserve — cannot justify cutting rates while inflation is rising. Higher-for-longer rates make bonds and cash more attractive relative to gold. The result is institutional selling of gold and sustained downward pressure on the price.
Why Stocks Are Rising While Gold Falls
One of the most striking features of this market environment is the divergence between gold and equities. While gold has fallen more than 10% since the war began, stock markets have pushed to new all-time highs. Tokyo’s Nikkei 225 broke the 60,000-point barrier for the first time in history. European bourses are rising. The S&P 500 has gained 13% from its end-of-March low.
The interpretation from equity markets is that the war will not be prolonged, and that technology and industrial companies will continue to grow regardless. Institutional investors are choosing stocks over gold as a growth vehicle. This rotation away from gold adds to the selling pressure and reinforces the downtrend in bullion prices.
Long-Term Price Forecasts from Major Institutions
Despite the current weakness, Wall Street’s biggest names remain broadly bullish on gold for the longer term. The structural case for gold — central bank diversification away from the dollar, geopolitical uncertainty, and eventual Fed rate cuts — has not changed. The short-term pain is seen as a temporary dislocation, not a reversal of the multi-year bull market.
| Institution | 2026 Gold Price Forecast | Key Drivers Cited |
|---|---|---|
| Goldman Sachs | $5,400 / oz by end-2026 | Central bank buying, Fed rate cuts, low speculative positioning |
| J.P. Morgan | $5,000–$6,300 / oz range | Investor demand, central bank diversification from USD |
| LiteFinance (Near-Term) | $4,645–$4,760 / oz | Dependent on FOMC tone and GDP data this week |
What Could Trigger a Gold Recovery?
Analysts point to three key conditions that would allow gold to recover meaningfully. First, a reopening of the Strait of Hormuz — if oil supply normalises, inflation pressure eases, and the Fed gains room to cut rates. Second, a clear signal from the Federal Reserve that rate cuts are coming — even a hint from Powell’s final press conference tonight could spark a rally. Third, a durable ceasefire or peace agreement between the US and Iran — removing the geopolitical uncertainty that is simultaneously keeping oil high and gold under pressure.
Any one of these conditions, if met, could drive a rapid reversal in gold. The long-term structural demand from central banks — particularly those diversifying reserves away from the US dollar — remains strong. Goldman Sachs notes that even a shift of 0.5% of foreign US asset holdings into gold would be sufficient demand to push prices to $6,000 per ounce.
What Traders and Investors Should Watch This Week
For gold traders and XAU/USD investors, this is one of the most event-heavy weeks of the year. The FOMC decision and Powell’s press conference on April 29 is the single most important event. Watch specifically for any language around rate cut timing, inflation trajectory, and how the Fed characterises the geopolitical risk. Beyond the Fed, the US Q1 GDP print on April 30 will give markets a clearer picture of how the war and oil shock have affected the broader economy. A weaker-than-expected GDP reading could increase expectations for eventual rate cuts — a positive for gold. A stronger reading would reinforce the “higher for longer” narrative and keep gold under pressure.
Traders should also monitor any developments in US-Iran diplomacy. Iran’s Hormuz reopening proposal is currently on the table. Any sign that Trump’s administration is willing to engage could send oil lower and gold higher very quickly.
