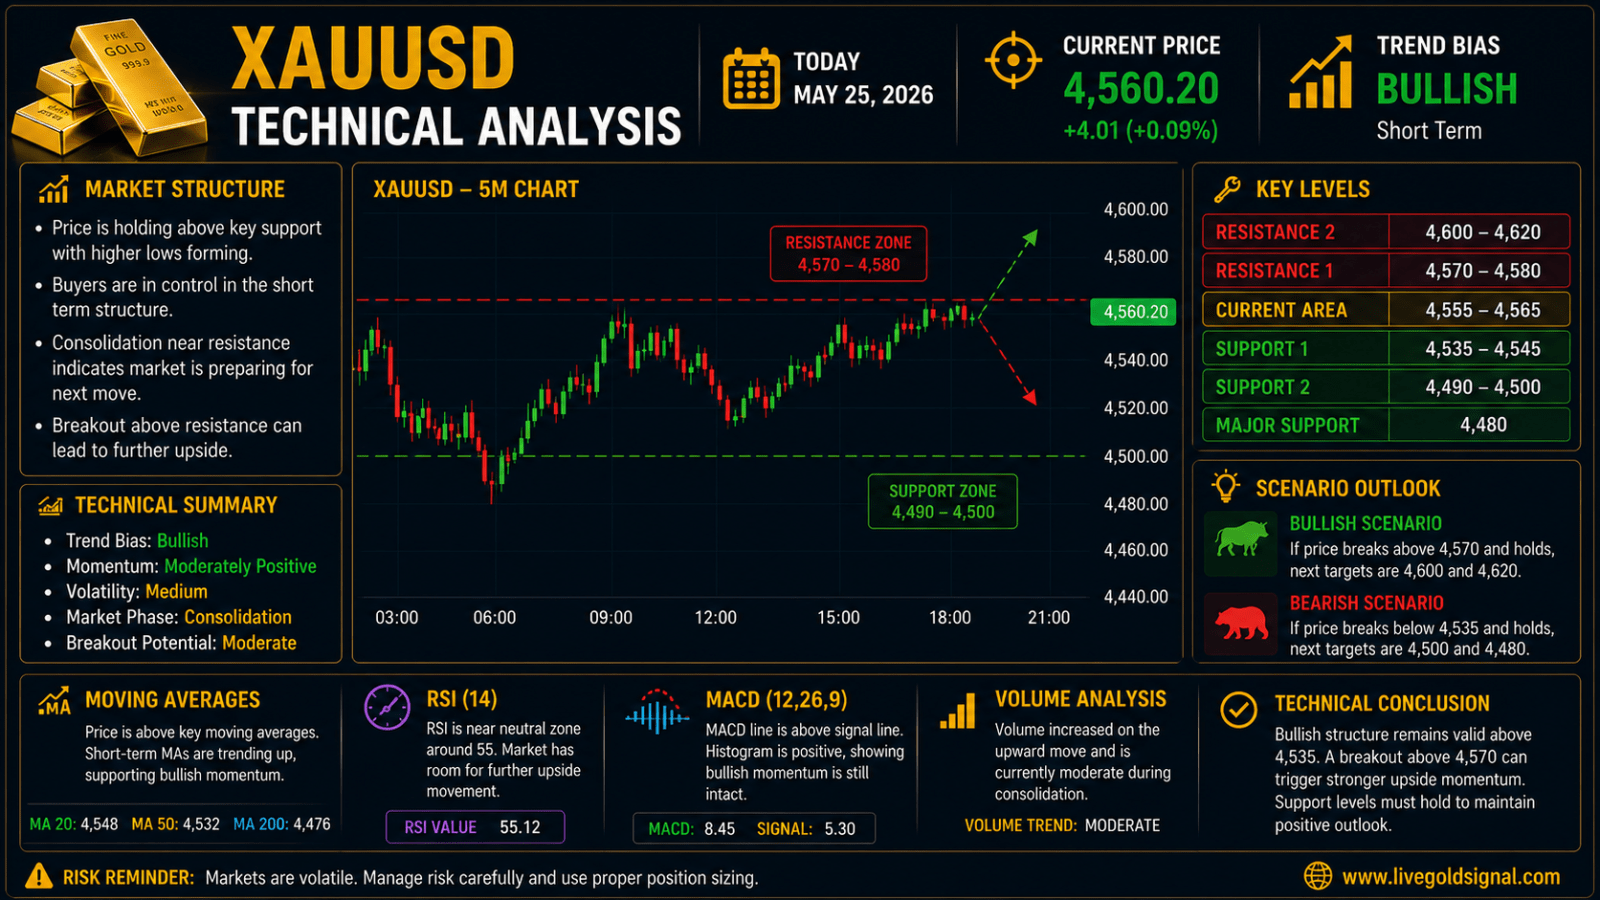
Gold is currently trading in an important technical region after a strong recovery movement from previous support areas. Based on the latest market structure, XAU/USD has shown a combination of bullish recovery and temporary consolidation behavior, suggesting that market participants are now waiting for stronger confirmation before pushing price toward the next major direction. The recent movement indicates that buyers managed to regain some control after defending lower support levels, though sellers are still active near upper resistance regions.
The latest chart structure shows that Gold initially experienced downward pressure before buyers entered aggressively and pushed the market upward. After reaching higher levels, price began consolidating rather than continuing immediately higher. Such behavior is commonly observed in markets preparing for the next major movement. Consolidation phases generally represent temporary equilibrium between buyers and sellers, where institutions and larger participants evaluate the next possible direction.
Current Market Structure Analysis
The current short term structure still favors buyers slightly because price remains above the recent support zone. Higher low formations continue to appear on the chart, which usually suggests that buying interest has not disappeared completely. In bullish conditions, markets often create sequences of higher lows and higher highs before extending upward again.
However, market participants should also observe the slowing momentum near recent highs. Price has not produced an aggressive continuation move after its recent rally. Instead, Gold has moved into a narrower range. This may indicate that buyers are becoming more cautious near resistance levels.
| Market Structure | Current Observation |
|---|---|
| Trend Bias | Short Term Bullish |
| Market Momentum | Moderately Positive |
| Current Behavior | Consolidation |
| Volatility | Medium |
| Breakout Potential | Moderate |
Support Zone Analysis
Support levels remain extremely important because they determine whether buyers still maintain market control. Based on the latest price movement, the nearest support area appears around 4535–4545. This zone acted as resistance earlier and later transformed into support after price successfully moved above it.
Support and resistance role reversals often become highly respected areas because traders who missed earlier opportunities frequently enter positions around these zones.
| Support Zone | Importance |
|---|---|
| 4535–4545 | Immediate Support |
| 4520–4510 | Secondary Support |
| 4490–4500 | Major Demand Area |
| 4480 | Strong Bearish Trigger |
If price continues holding above the 4535 area, buyers may attempt another upward movement. However, a clean breakdown below support would increase selling pressure.
Resistance Zone Analysis
Resistance levels currently remain the primary challenge for bullish continuation. Price recently attempted to push higher but encountered selling pressure near upper regions. Sellers often enter near resistance because profit taking activities increase and new short positions begin appearing.
| Resistance Level | Importance |
|---|---|
| 4570–4580 | Immediate Resistance |
| 4600–4620 | Major Resistance |
| 4650–4660 | Strong Supply Area |
| 4680–4700 | Extended Bullish Target |
A successful breakout above 4580 may create stronger bullish momentum and attract additional buying pressure toward higher levels.
Moving Average Analysis
Moving averages continue showing moderate bullish strength. Price remains above shorter moving averages, which usually suggests positive short term sentiment. However, moving averages have started flattening slightly compared to earlier periods. This means bullish momentum may be slowing temporarily.
When moving averages flatten, markets often enter temporary range conditions before choosing the next trend direction.
RSI Momentum Analysis
Relative Strength Index behavior suggests that buying pressure remains present, though extreme bullish conditions are not visible. RSI recently recovered from lower areas and now trades around neutral territory.
Neutral RSI readings often indicate that markets still have room for movement in either direction. Traders generally watch for divergence signals near resistance and support levels.
MACD Analysis
MACD indicators suggest that momentum remains slightly positive. Histogram behavior indicates that bearish pressure has weakened compared with previous sessions.
However, stronger confirmation will still be needed before expecting aggressive bullish continuation. Mixed signals frequently appear before large market movements occur.
Volume Analysis
Trading volume analysis shows that recent upward movement was supported by increasing participation from buyers. However, current consolidation phases indicate that market activity has slowed slightly.
Lower volume during consolidation often means traders are waiting for stronger confirmation before entering larger positions.
Technical Outlook
Overall technical conditions continue favoring a cautiously bullish outlook while price remains above important support regions. Buyers still maintain some control over the short term structure, though resistance levels continue creating pressure on upward movement.
If Gold successfully breaks above immediate resistance around 4570–4580, additional upside movement toward 4620 and beyond may become possible. Alternatively, failure to maintain support above 4535 could increase downside pressure and trigger deeper corrections.
Current market conditions suggest that traders should remain patient and wait for stronger confirmation before expecting large directional movements. The market appears to be entering a decision phase where a breakout above resistance or breakdown below support will likely determine the next major trend.