
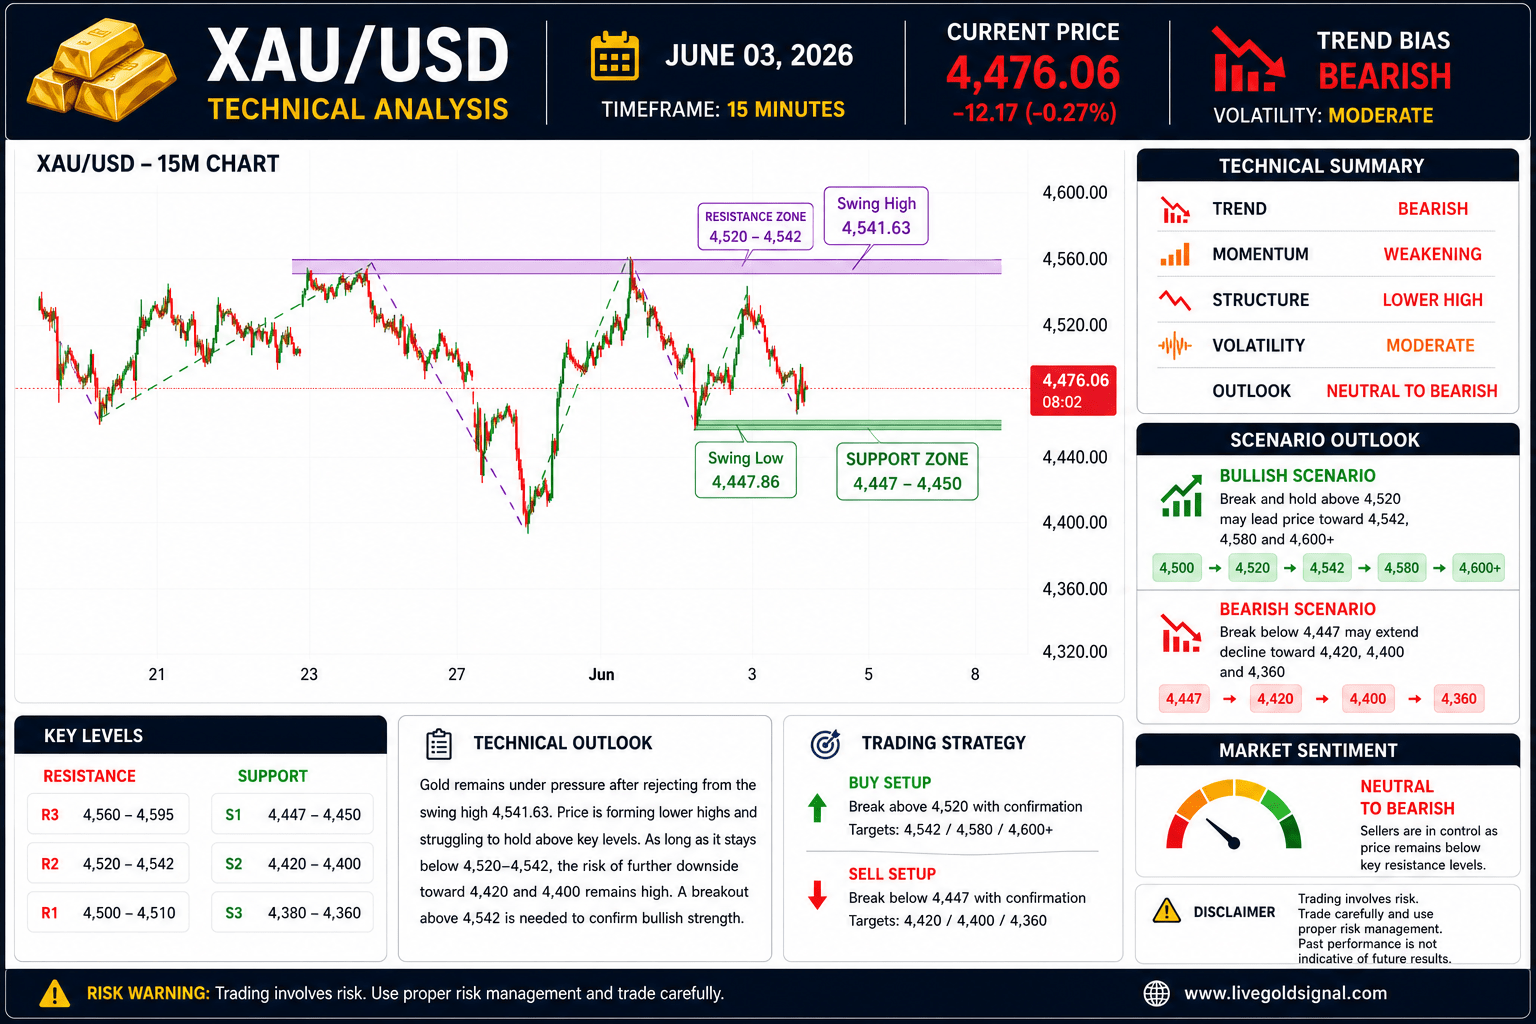
Gold (XAU/USD) continues to trade under short term bearish pressure on June 03, 2026, as the market struggles to recover above major resistance levels. Based on the latest 15-minute chart structure, price remains trapped between the important resistance zone near 4,520–4,542 and the support area around 4,447.86. Recent price action suggests that sellers still maintain control of the short term trend despite occasional recovery attempts from buyers.
The chart shows a clear sequence of lower highs and lower lows after the rejection from the swing high near 4,541.63. This pattern is often considered a classic bearish market structure because it indicates that buyers are losing momentum while sellers continue defending higher levels. Although gold managed to bounce from the support zone around 4,447.86, the recovery remains weak and has not yet changed the overall bearish outlook.
| Technical Overview | Value |
|---|---|
| Current Price | 4,476.06 |
| Trend Bias | Bearish |
| Market Structure | Lower High Formation |
| Volatility | Moderate |
| Short Term Outlook | Neutral to Bearish |
Current Market Structure
The most important feature on the current chart is the formation of lower highs following the rejection from 4,541.63. Every attempt to move higher has been met with selling pressure, preventing buyers from establishing a sustainable uptrend. This behavior suggests that market participants remain cautious about paying significantly higher prices at the moment.
From a structural perspective, gold remains below the major swing high while trading only slightly above the key support area. This positioning creates a bearish environment because the market is closer to breaking support than it is to breaking resistance. Unless buyers can generate strong momentum above recent highs, sellers may continue to dominate price action.
The repeated rejection from higher levels also indicates that institutional traders may still be reducing long exposure. When major market participants sell into rallies, price often forms lower highs before eventually breaking important support zones.
Support And Resistance Analysis
Support and resistance remain the most important elements of today’s technical outlook. The nearest support level is located around 4,447–4,450. This area has already demonstrated its significance by attracting buyers during previous declines. A successful defense of this support could allow gold to stabilize and potentially attempt another recovery toward resistance.
However, if sellers manage to push the market below 4,447, downside momentum could increase significantly. The next major support levels are located near 4,420, followed by 4,400 and eventually the broader support zone around 4,360–4,380.
On the upside, the first resistance area remains near 4,500–4,510. This level must be broken before buyers can challenge the stronger resistance zone around 4,520–4,542. A decisive breakout above 4,542 would invalidate much of the current bearish structure and potentially trigger a stronger bullish continuation toward 4,580 and 4,600.
| Resistance Levels | Support Levels |
|---|---|
| 4,500 – 4,510 | 4,447 – 4,450 |
| 4,520 – 4,542 | 4,420 – 4,400 |
| 4,560 – 4,595 | 4,380 – 4,360 |
Momentum Analysis
Momentum currently favors sellers. Although gold has managed to avoid a complete breakdown below support, buying pressure remains limited. The recovery attempts seen during recent sessions have produced relatively weak advances compared to previous declines. This imbalance suggests that bearish momentum remains dominant.
When a market experiences stronger selling waves than buying waves, traders typically interpret this as evidence that trend direction remains unchanged. Unless momentum indicators begin showing clear bullish divergence, the path of least resistance remains slightly lower.
Short term momentum could improve if price successfully reclaims the 4,500 level. However, even such a recovery would still need confirmation through a breakout above the major resistance zone near 4,542.
Trend Analysis
The short term trend remains bearish due to the lower high pattern visible on the chart. Trend traders generally focus on whether price continues making lower highs and lower lows. As long as this sequence remains intact, bearish conditions continue to dominate market sentiment.
Medium term trend conditions remain mixed because gold is still trading significantly above the broader swing low near 4,366. This means the market has not completely abandoned its previous recovery structure. Nevertheless, current price action suggests that the medium term recovery may be entering a correction phase.
Long term traders may continue monitoring major support levels for signs of renewed institutional accumulation. Until such evidence appears, the market may remain vulnerable to additional downside pressure.
Bullish Technical Scenario
The bullish scenario requires a breakout above 4,500 followed by a successful move through the major resistance zone between 4,520 and 4,542. If buyers achieve this objective, technical sentiment would improve significantly.
A confirmed breakout above 4,542 would likely attract additional momentum traders and could open the door for a rally toward 4,580. Further strength could eventually target the broader resistance zone around 4,595–4,600.
Bullish traders should look for strong candle closes above resistance rather than temporary price spikes. Confirmation remains essential because false breakouts are common during consolidation periods.
Bearish Technical Scenario
The bearish scenario remains the primary outlook for today’s session. A decisive break below 4,447 would confirm additional weakness and increase the probability of a move toward 4,420 and 4,400.
If selling pressure accelerates, the market could eventually revisit the broader support region around 4,360. This area represents an important technical zone because it previously generated a significant recovery.
Continued lower highs would strengthen the bearish case and encourage additional sellers to enter the market.
Market Outlook
Gold remains trapped within a critical technical range. The market is currently testing trader confidence as both buyers and sellers attempt to establish control. However, the visible chart structure continues to favor sellers because resistance remains intact and momentum remains relatively weak.
The coming trading sessions may determine whether gold enters a deeper correction or resumes its broader recovery trend. Until resistance levels are broken, traders should continue respecting the existing bearish structure.
Technical Conclusion
XAU/USD enters June 03, 2026 with a bearish short term technical outlook. The swing high at 4,541.63 continues acting as major resistance while support remains concentrated around 4,447.86. A break below support could trigger additional declines toward 4,420, 4,400 and 4,360. Conversely, a breakout above 4,542 would shift momentum back in favor of buyers and potentially open the path toward 4,580 and 4,600. Traders should focus on these key levels while maintaining disciplined risk management and waiting for confirmation before entering new positions.