
Gold Price Outlook, Key Levels, Market Sentiment, and Trading Scenarios for June 03, 2026
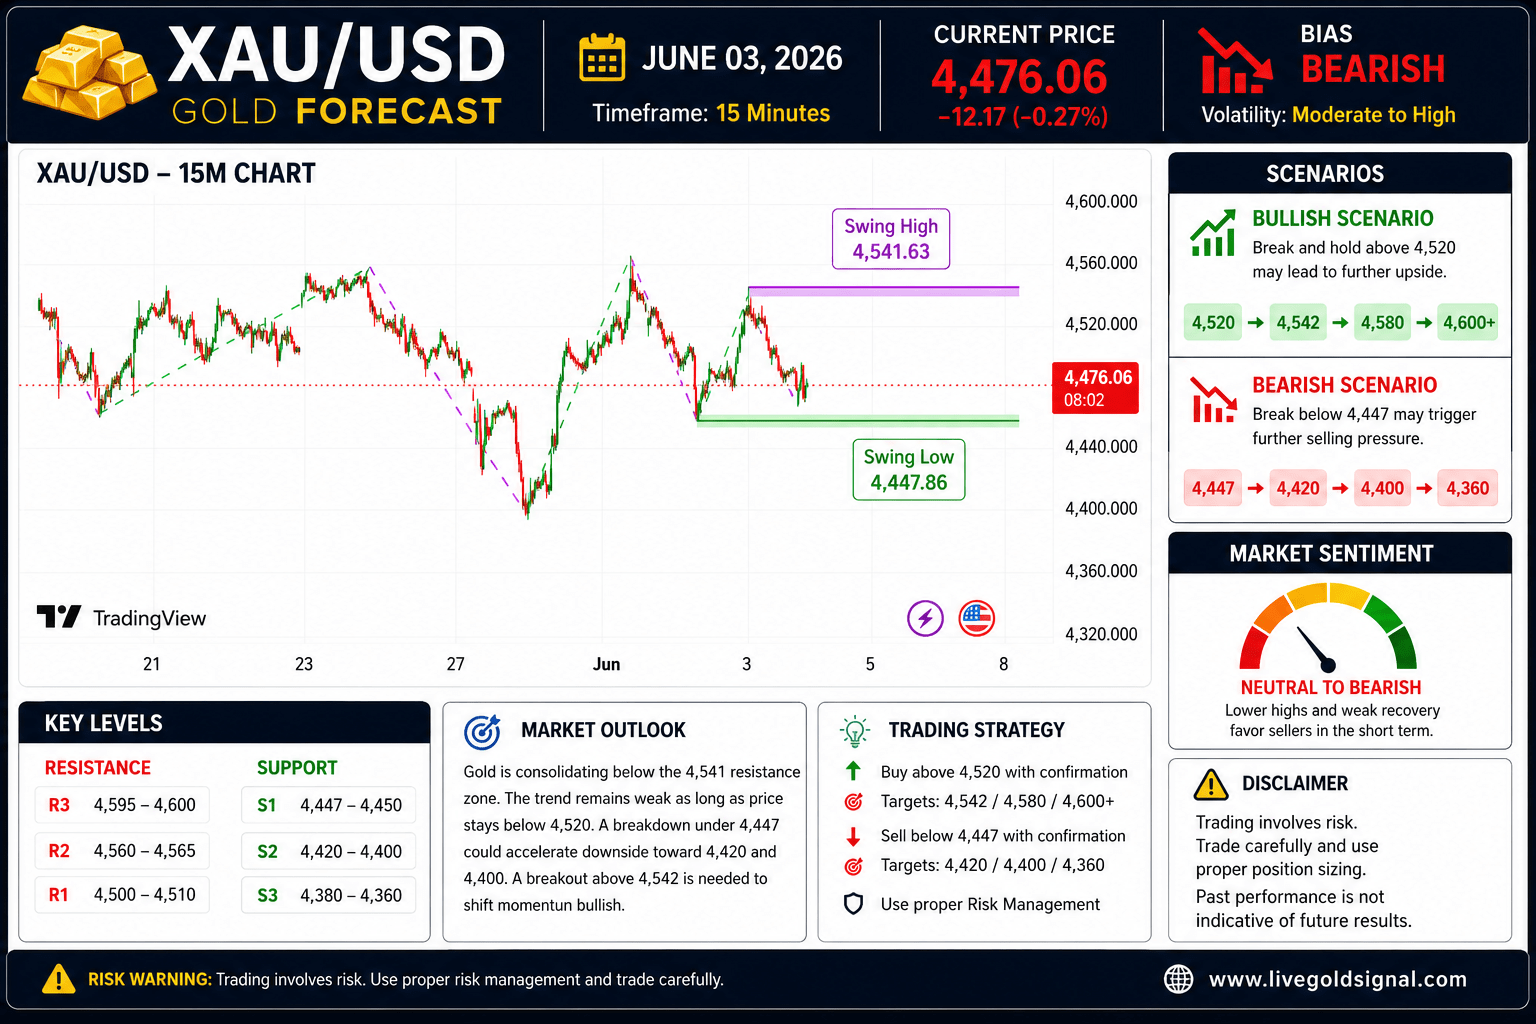
XAU/USD remains under pressure after failing to sustain gains above the recent recovery highs. Gold experienced strong buying momentum during the previous sessions, but sellers re-entered the market near the 4,540 resistance area, creating a corrective pullback toward the 4,470 region. Despite the recent decline, the broader structure still shows that buyers are actively defending major support zones, which keeps the medium-term bullish recovery scenario alive.
At the time of analysis, gold is trading near the 4,475 area after experiencing increased volatility around major economic developments and shifting expectations regarding U.S. monetary policy. Traders are now closely monitoring whether buyers can maintain control above the 4,450 support region or whether additional downside pressure could push prices toward deeper support levels.
The market remains highly sensitive to U.S. Dollar movements, Treasury yields, geopolitical developments, and expectations surrounding future Federal Reserve policy decisions. These factors are expected to continue driving volatility throughout today’s trading sessions.
| Market Overview | Current Outlook |
|---|---|
| Trend Bias | Neutral to Bullish |
| Volatility | Moderate to High |
| Market Structure | Corrective Pullback |
| Short-Term Direction | Range Bound |
| Medium-Term Direction | Bullish Recovery Possible |
Current Market Structure
The recent price action suggests that gold is currently moving within a corrective phase after completing a strong bullish rebound from the major swing low near 4,447. The rally toward the 4,541 resistance area attracted profit-taking activity, causing a temporary pullback.
While bears currently hold short-term momentum, they have not yet succeeded in breaking the key support region that would invalidate the broader recovery structure. As long as price remains above the 4,447 support zone, buyers maintain an opportunity to regain control and target higher resistance levels.
The chart structure shows lower highs forming during the latest correction, but support levels continue to hold. This creates a market environment where traders should monitor breakout confirmations before committing to directional positions.
Important Resistance Levels
| Resistance Level | Importance |
|---|---|
| 4,500 | Immediate Resistance |
| 4,520 | Short-Term Breakout Zone |
| 4,541 | Recent Swing High |
| 4,560 | Major Resistance |
| 4,595 | Primary Bullish Target |
The first challenge for buyers remains the 4,500 psychological level. A sustained move above this area would likely encourage additional buying interest.
Above 4,500, the next important resistance zone appears around 4,520. A successful breakout above this level could significantly improve bullish momentum and open the door for another test of the recent swing high near 4,541.
If buyers manage to clear 4,541 decisively, the market could accelerate toward 4,560 and eventually the major resistance area around 4,595.
Important Support Levels
| Support Level | Importance |
|---|---|
| 4,470 | Immediate Support |
| 4,450 | Major Support Zone |
| 4,447 | Recent Swing Low |
| 4,420 | Secondary Support |
| 4,366 | Major Structural Support |
The most important area for buyers remains the support zone between 4,447 and 4,450. This region previously triggered a strong recovery rally and continues to represent a significant technical foundation.
A breakdown below this area would weaken bullish sentiment considerably and could trigger additional selling pressure toward 4,420.
If bearish momentum accelerates further, traders may witness a larger decline toward the major structural support region around 4,366.
Technical Indicator Analysis
RSI Analysis:
The Relative Strength Index remains near neutral territory, indicating that neither buyers nor sellers currently possess overwhelming momentum. This suggests that the market may continue consolidating until a significant catalyst emerges.
Moving Average Analysis:
Short-term moving averages have started flattening after the recent decline. This reflects slowing bearish momentum and increases the possibility of consolidation before the next directional move develops.
Price Action Analysis:
Current price action shows that gold remains trapped between major support and resistance levels. Such conditions often lead to breakout opportunities once sufficient momentum accumulates.
Market Momentum:
Momentum indicators suggest weakening bearish pressure compared to the previous session. While sellers still maintain some control, buyers are gradually attempting to stabilize the market near support levels.
Bullish Forecast Scenario
For the bullish scenario to develop, buyers must successfully defend the 4,450 support zone and reclaim the 4,500 resistance level.
If price establishes support above 4,500 and closes convincingly above 4,520, bullish momentum could strengthen significantly. Under this scenario, gold may target 4,541, followed by 4,560 and eventually 4,595.
A strong breakout above 4,595 would indicate renewed bullish dominance and could open the path toward even higher levels in subsequent sessions.
Positive economic surprises, weaker U.S. Dollar performance, declining Treasury yields, or increased safe-haven demand could act as catalysts supporting this bullish outlook.
Bearish Forecast Scenario
The bearish scenario becomes more likely if gold fails to hold above the 4,450 support region.
A confirmed breakdown below 4,447 could trigger additional selling pressure toward 4,420. If sellers maintain momentum below that level, the market may revisit the major support region around 4,366.
Further strength in the U.S. Dollar, rising Treasury yields, or stronger-than-expected economic data could support bearish continuation during today’s session.
Traders should monitor price behavior carefully around support levels because breakdown confirmation remains essential before anticipating extended downside movement.
Fundamental Factors To Watch Today
- U.S. Dollar Index Performance
- Federal Reserve Policy Expectations
- U.S. Treasury Yield Movements
- Economic Data Releases
- Global Risk Sentiment
- Geopolitical Developments
- Institutional Gold Demand
- Inflation Expectations
These fundamental drivers have the potential to increase market volatility and significantly influence gold’s direction throughout the trading day.
Trading Strategy Considerations
Conservative traders may prefer waiting for confirmed breakouts above resistance or below support before entering positions.
Aggressive traders may consider range-trading opportunities while the market remains trapped between major technical levels.
Risk management remains essential because gold continues experiencing elevated volatility. Position sizing, stop-loss placement, and confirmation signals should always be incorporated into any trading plan.
Forecast Summary
XAU/USD remains in a corrective phase but continues holding above critical support levels. The broader recovery structure remains intact while price stays above the 4,447 support zone.
Buyers need a breakout above 4,520 to regain momentum and target 4,541, 4,560, and 4,595. Conversely, a breakdown below 4,447 could trigger further weakness toward 4,420 and potentially 4,366.
Overall, the outlook for June 03, 2026 remains cautiously bullish as long as key support levels continue holding. Traders should remain flexible and focus on confirmation signals while managing risk appropriately in this volatile market environment.
