
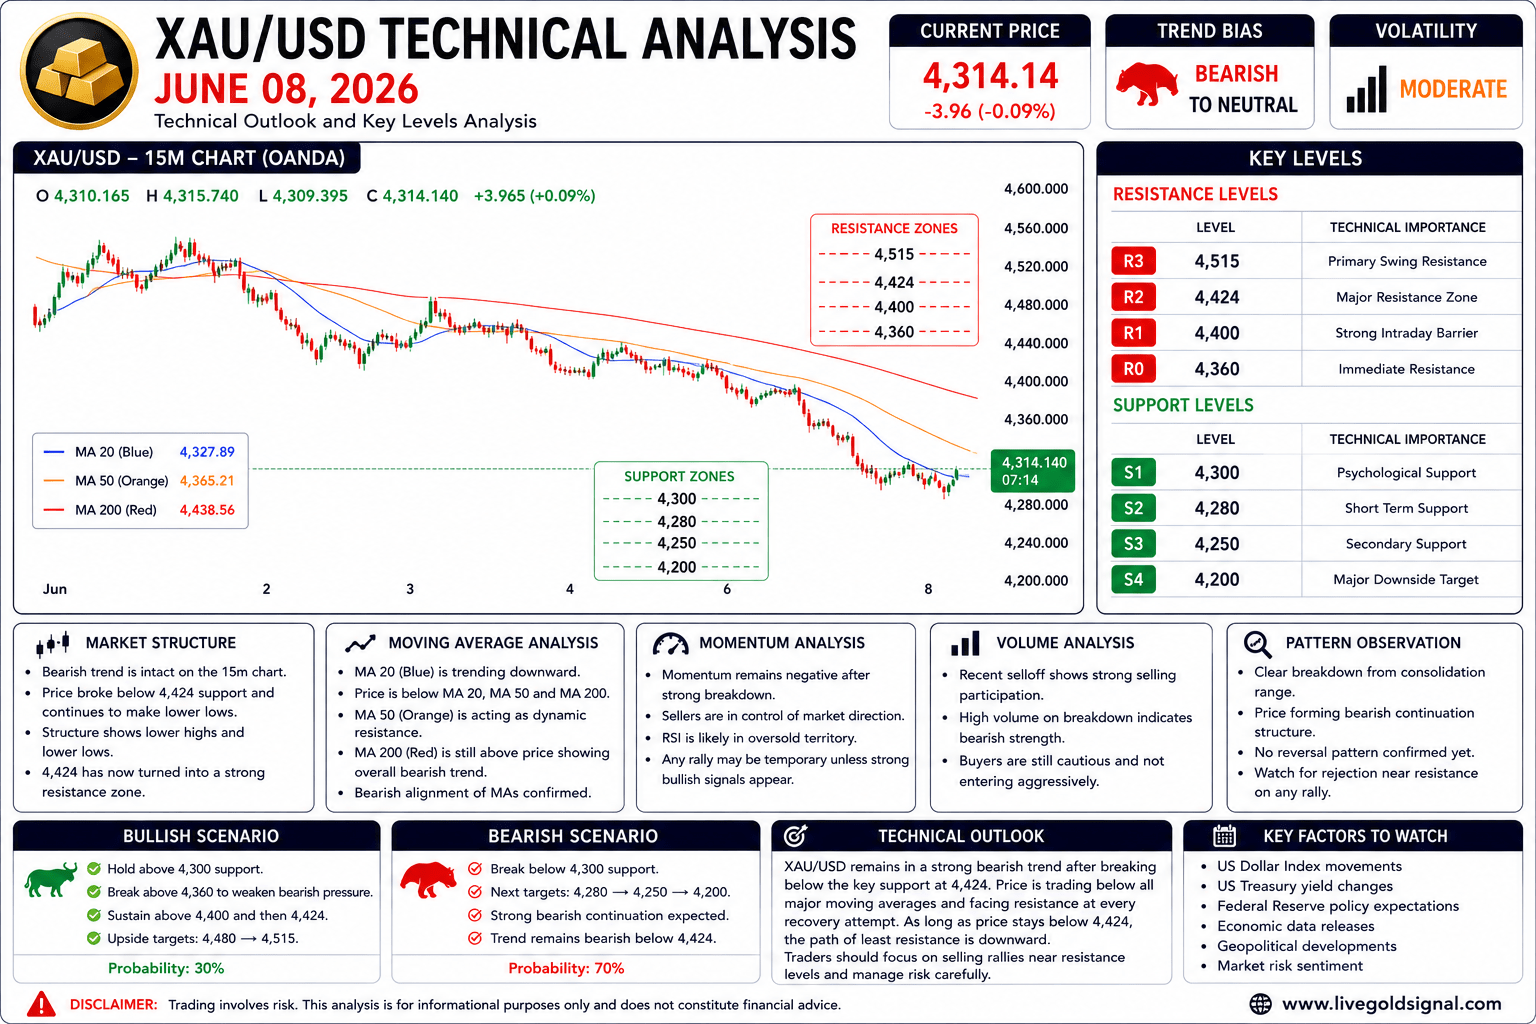
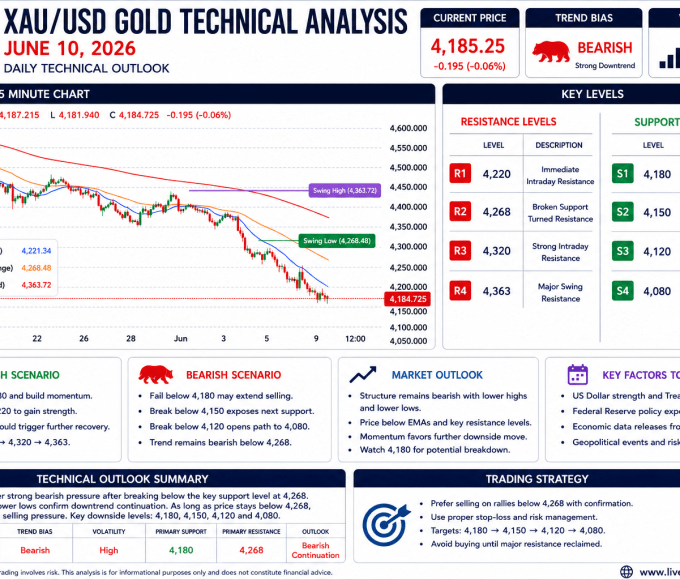
Gold (XAU/USD) remains under heavy bearish pressure during the June 08 trading session as sellers continue to dominate the short term market structure. Based on the latest 15-minute chart, price is trading near 4,314 after a significant breakdown below the previously established support zone around 4,424. The recent selloff confirms that bearish momentum remains strong, while buyers are struggling to regain control. The market has now entered a new lower trading range, and unless a strong recovery develops, the technical outlook continues to favor additional downside movement.
The most important development on the current chart is the decisive break below the former support area near 4,424. This level had acted as a strong demand zone for several sessions, with buyers repeatedly defending the area. However, the recent breakdown invalidated that support structure and triggered a fresh wave of selling pressure. Once the support failed, price accelerated sharply lower and reached the 4,300 region, confirming a major shift in market sentiment.
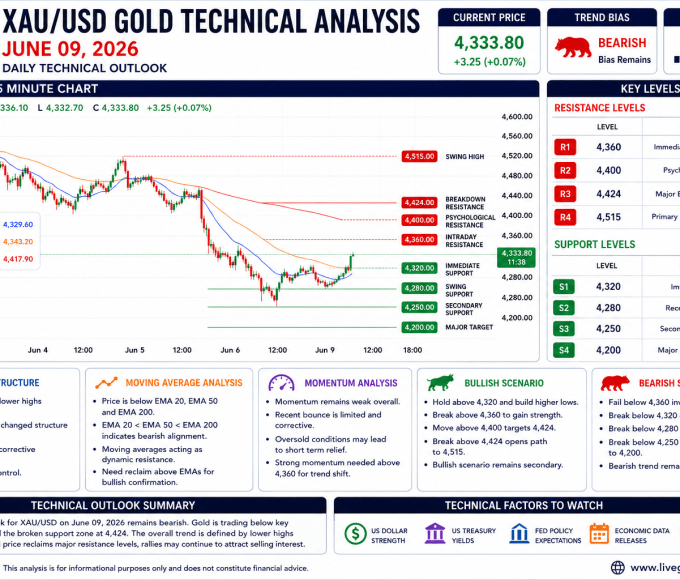
Market Structure Analysis
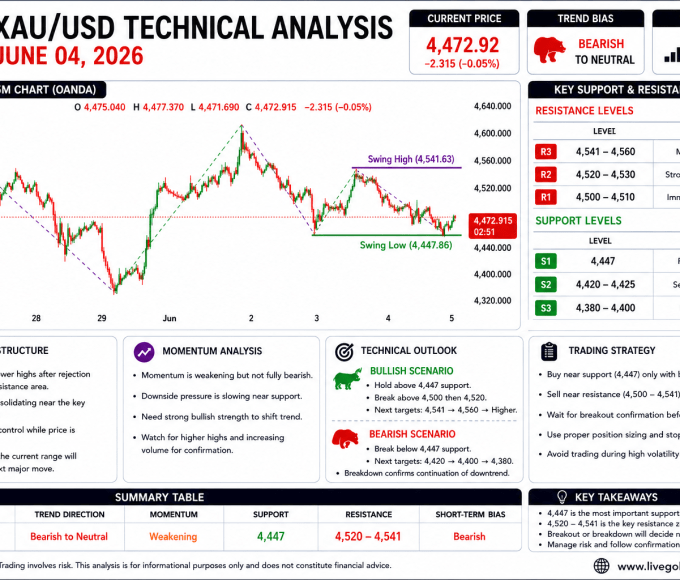
The overall structure clearly reflects a bearish trend. Since the swing high near 4,515, gold has been forming a consistent pattern of lower highs and lower lows. This is one of the strongest indications that sellers remain in control. Every recovery attempt has been met with fresh selling pressure, preventing buyers from establishing any sustainable bullish structure.
The previous support zone around 4,424 has now become a significant resistance area. This role reversal is a common characteristic of trending markets. Traders should expect sellers to defend this zone aggressively if price attempts a recovery. As long as gold remains below this level, the broader bearish structure remains intact.
Current price action also shows that market participants are accepting lower prices. Instead of quickly reversing after the breakdown, price continues to consolidate near the lows. This behavior often signals bearish continuation rather than immediate recovery.
Moving Average Analysis
Moving averages continue to support the bearish outlook. Short term moving averages have likely crossed below medium term averages following the sharp decline. This alignment indicates that downside momentum remains dominant.
Price is currently trading below major moving averages, which suggests that sellers continue to control market direction. In many cases, when price remains below key moving averages after a breakdown, those averages begin acting as dynamic resistance levels.
For sentiment to improve, buyers would need to reclaim the nearest moving average cluster and hold above it. Until that occurs, rallies are likely to be viewed as corrective movements within a broader bearish trend.
Momentum Analysis
Momentum remains negative following the recent breakdown. The speed of the decline indicates strong participation from sellers and confirms that bearish sentiment remains widespread. Large directional moves of this nature often attract additional trend-following traders, which can further extend the downside move.
Although short term oversold conditions may occasionally trigger temporary rebounds, these moves should not automatically be interpreted as trend reversals. The market would require substantial buying volume and multiple higher highs before a genuine bullish recovery could be confirmed.
The current momentum profile suggests that sellers continue to have the advantage. Any bounce toward resistance levels should be monitored carefully for potential rejection signals.
Support And Resistance Analysis
| Resistance Level | Technical Importance |
|---|---|
| 4,360 | Immediate Resistance |
| 4,400 | Strong Intraday Barrier |
| 4,424 | Major Resistance Zone |
| 4,515 | Primary Swing Resistance |
| Support Level | Technical Importance |
|---|---|
| 4,300 | Psychological Support |
| 4,280 | Short Term Support |
| 4,250 | Secondary Support |
| 4,200 | Major Downside Target |
Volume And Participation
The recent decline suggests strong seller participation across the market. Large bearish candles combined with sustained pressure near the lows indicate that institutional traders may be actively reducing long exposure or adding fresh short positions. This behavior typically strengthens bearish trends and can delay recovery attempts.
The absence of a strong bullish reversal after the breakdown also indicates that buyers remain cautious. Market participants appear unwilling to aggressively buy until clearer signs of stabilization emerge.
Bullish Technical Scenario
Although the current trend remains bearish, traders should still consider potential bullish recovery scenarios. For a meaningful recovery to develop, gold must first establish support above 4,300 and prevent further downside expansion.
A recovery above 4,360 would represent the first positive technical signal. If buyers then reclaim 4,400 and successfully close above 4,424, sentiment could improve significantly. Under such circumstances, upside targets may extend toward 4,480 and eventually the major resistance zone near 4,515.
However, at the current stage, this remains the less probable scenario because market structure continues to favor sellers.
Bearish Technical Scenario
The bearish scenario remains the primary technical outlook. As long as gold trades below 4,424 and especially below 4,400, sellers are expected to maintain control. Every recovery attempt toward resistance levels may attract fresh selling pressure.
A break below 4,300 could trigger another wave of downside momentum. If this support fails, the next targets become 4,280 and 4,250. Further weakness could expose the major downside objective around 4,200.
The probability of bearish continuation remains elevated because current price action continues to respect the existing downtrend structure.
Market Sentiment Analysis
Current sentiment remains bearish to neutral. Market participants continue to react negatively to the recent breakdown, while buyers remain largely defensive. Until price can reclaim major resistance levels, sentiment is unlikely to improve significantly.
The fact that gold remains below both structural resistance and moving average resistance reinforces the bearish outlook. Traders should remain cautious when attempting countertrend positions.
Technical Outlook For June 08, 2026
The technical outlook for XAU/USD remains bearish. The decisive break below 4,424 support has shifted market control firmly toward sellers. Current price action around 4,314 indicates continued downside pressure, while resistance levels remain well above the market.
Unless buyers can reclaim 4,400 and then recover above 4,424, rallies are likely to be viewed as selling opportunities. Downside targets remain 4,300, 4,280, 4,250, and potentially 4,200 if bearish momentum strengthens further.
From a technical perspective, the path of least resistance remains lower. Traders should focus on risk management, confirmation signals, and key support levels while monitoring whether sellers can maintain their current dominance throughout the session.