

Q1 2026 Closes — The Quarter That Changed Everything
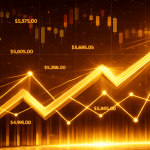
Q1 2026 ends today as one of the most turbulent quarters in gold's modern history. The quarter began with gold at approximately $4,400, surged to the all-time high of $5,595 on January 29 as rate-cut optimism peaked, then reversed violently lower as the US-Iran war began on March 2 and the oil-inflation-rate paradox took hold. The net Q1 result, despite the extraordinary volatility, is a modest positive: gold is up approximately 4% for the quarter — a deceptively calm number that masks a $1,500 peak-to-trough journey within a single 13-week period. Quarter-end rebalancing by institutional investors — many of whom must reset their gold allocations to target weights after such dramatic price moves — is contributing to today's recovery bounce. Investors who were underweight gold heading into Q1 and are now significantly more underweight after the correction are using today's quarter-end as an opportunity to add exposure at what many regard as distressed prices.
RoboForex's March 30 analysis frames the current situation with precision: "Over the month, market expectations for gold have turned upside down. Before the armed conflict between the US, Israel, and Iran, the market was pricing in two Federal Reserve rate cuts in 2026. Now, traders see less than a 10% chance of a rate cut this year, while CME FedWatch shows more than a 50% probability of a rate hike by the end of the year." This is the fundamental reason for gold's correction — not a change in gold's structural value, but a radical repricing of the monetary environment that determines the opportunity cost of holding it. The investment thesis has shifted from "buy gold because rates are going lower" to "buy gold because stagflation is arriving and paper currency is being debased by energy shocks." The second thesis is actually a stronger long-term argument for gold — it just takes longer for the market to accept it.
OECD: US inflation 4.2% in 2026 + GDP growth 2.0% = Stagflation confirmed. February jobs: -92,000 (CBS News) = labor market cracking. CME FedWatch: >50% rate hike probability by December 2026. Short-term: rate hike fears suppress gold. Medium-term: when growth cracks further under rate hikes, the Fed pivots dramatically — and gold explodes from deeply oversold levels. This is the stagflation playbook, and gold wins it every time historically.
OECD's 4.2% Inflation Forecast — What It Really Means for Gold
The OECD's March 26 report raised its US inflation forecast to 4.2% for 2026 — up 1.2 percentage points from its December projection and more than double the Federal Reserve's 2% target. The organization explicitly attributed this revision to the Iran war's disruption of energy flows through the Strait of Hormuz. The forecast assumes that energy market disruptions will moderate from mid-2026 onwards — a conditional assumption that depends entirely on diplomatic resolution of the conflict. If the war continues past June 2026, the OECD explicitly warns that inflation could be even higher and growth even lower than the baseline projection. Global G20 inflation is forecast to reach 4.0% in 2026, with the UK facing even higher rates as it is the OECD's most vulnerable major economy to energy price shocks. Europe faces an elevated recession risk, with Germany, Italy, and the UK most exposed.
For gold, the 4.2% inflation forecast creates a dual dynamic. In the short term, it confirms that the Fed will remain hawkish — the OECD itself notes that "central banks should remain vigilant" and implicitly endorses the Fed's current hold stance. A hawkish Fed is bearish for gold through the real yield mechanism. But on a three-to-twelve-month view, 4.2% inflation running into slowing growth and a cracking labor market creates the classical stagflation environment in which gold has historically generated its most powerful returns. The 1970s stagflation period saw gold appreciate approximately tenfold. The current situation, while structurally different, shares the essential features: oil-driven inflation, slowing growth, and a central bank caught between two competing objectives. Carson Group's chief macro strategist Sonu Varghese told CBS News directly: "It's likely the Fed will not cut rates in 2026 and may even start talking about rate hikes later this year." When the market is pricing rate hikes and gold is trading at $4,500 — 20% below its all-time high — the risk-reward for forward-looking investors has rarely been more compelling.
February Jobs Data — Stagflation Confirmed
The CBS News report that US employers shed 92,000 jobs in February is one of the most significant data points of the entire quarter for gold's medium-term outlook. A negative payrolls print — the first in over two years — occurring simultaneously with 4.2% inflation is the textbook definition of stagflation in real-time data. The Fed's dilemma is now explicit and severe: cut rates to support a labor market shedding jobs, and inflation — already heading toward 4.2% — accelerates further. Hold or raise rates to fight inflation, and the labor market deterioration worsens. PNC economist Gus Faucher summarized the bind for CBS News: "The job market has softened over the past few years, and inflation is running higher than the Fed would like and will pick up even more in the near term. This could create a dilemma for the central bank — cut the fed funds rate to support the labor market and inflation could move even higher, or keep the fed funds rate where it is and risk further weakness in the labor market." This is precisely the scenario in which gold performs best historically — and it is the scenario that is now playing out in US economic data.
Key Levels for March 31
Support Levels
Resistance Levels
This Week's Macro Calendar — The Jobs Week
| Date | Event | Forecast | Gold Impact if Weak |
|---|---|---|---|
| Today Mar 31 | JOLTS Job Openings (Feb) | ~7.6M | ↑ Below 7.0M = stagflation floor = bullish gold |
| Wed Apr 1 | ADP Employment + ISM Manufacturing PMI | ~120K | ↑ Negative ADP = recession fear = bullish gold |
| Thu Apr 2 | Initial Jobless Claims | ~220K | ↑ Above 240K = labor crack = bullish gold |
| Fri Apr 3 | Non-Farm Payrolls + Unemployment Rate | ~80–100K | ↑ Second negative NFP = Fed pivot signal = explosive gold rally |
| Sun Apr 6 | Trump Energy Strike Pause Expires | Binary | Deal = oil falls = rate cuts revive = gold $5,000+ |
| Thu Apr 10 | March CPI — First Post-War Reading | 3.0%–3.5% | ↑ Stagflation confirmed = gold ultimate hedge |
Gold Price Forecast for March 31 2026
Today's quarter-end session is producing the first meaningful recovery bounce since the correction began — gold at $4,564, up 1.59%, with a day high of $4,578. LiteFinance's intraday analysis projects gold targeting the March 25 high at $4,602 as the immediate upside target, with the upper Target Zone at $4,635–$4,689 as the next meaningful resistance if $4,602 breaks. RoboForex identifies the Hammer reversal pattern on the H4 chart near the lower Bollinger Band as the technical signal supporting continued upward movement toward $4,695. The key support zone for holding the recovery is $4,372–$4,349 — a break below which would signal the trend turning bearish again. Today's JOLTS data at 10:00 AM EST could add to the stagflation narrative if job openings fall sharply, reinforcing the case for gold as the definitive hedge for an economy that is simultaneously experiencing inflation and labor market deterioration. The next seven days — JOLTS today, ADP Wednesday, NFP Friday, April 6 diplomatic deadline — will determine whether the $4,099 low is truly the bottom of this correction cycle.
Gold recovers +1.59% to $4,564 on Q1 close. OECD: US inflation 4.2% in 2026. CME FedWatch: >50% rate hike probability by December. February jobs: -92,000. Oil pulling back. LiteFinance target $4,602. RoboForex Hammer pattern targets $4,695.
Bias: Cautiously Bullish — the stagflation trade is now the dominant medium-term thesis. Today's JOLTS data, this week's NFP, and April 6 diplomatic deadline are the catalysts. The correction from $5,595 to $4,099 is the setup for the next major bull leg. Gold at $4,564 with OECD projecting 4.2% inflation is structurally compelling.
Get Real-Time Gold Signals Every Day
Professional XAU/USD trade alerts with exact entry, stop loss and take profit levels — delivered every morning before the market opens.
Subscribe Now TodayRisk Warning: Trading gold and foreign exchange carries significant risk. Past performance is not indicative of future results. This content is for educational and informational purposes only and does not constitute financial advice. Always use proper risk management and never risk more than you can afford to lose.