
Meet Your New Trading Companion
Tired of messy charts, late signals, and arrows that vanish after the move is over? Gold Ribbon Scanner was built to fix exactly that.
It wraps your price with two smart volatility bands that move with the market. When a candle closes outside a band, the trend has truly changed, and you get a clean BUY or SELL arrow with the signal price printed right beside it. No clutter, no guessing, no signals that jump around.It was designed for gold (XAUUSD), where moves are fast and noise is everywhere. Because it works on price and volatility only, you can also test it on other symbols and timeframes.
⭐ Why Traders Will Love It
Signals That Stay Put
Every signal is confirmed on a closed candle. Once an arrow shows up, it never moves and never disappears.
A Trend Line That Thinks
It reacts faster when the market is moving and calms down when the market is quiet, so you are not fooled by every small wiggle.
Bands That Breathe
A blue upper band and a red lower band grow wider in wild markets and tighter in calm ones.
Trend at a Glance
Blue candles mean buyers lead. Red candles mean sellers lead. You can read the market in one second.
Price Written on Every Arrow
Each signal carries its price, like "Buy 4153.72", so you can review your history easily.
Live Signal Box
See your latest signal, entry price, time, and candle countdown without leaving the chart.
💎 Get Your Lifetime License
ONE-TIME PAYMENT
$299
Lifetime License
✓
Pay once and use it for life
✓
No subscription, no monthly or yearly fees
✓
Non-repainting BUY and SELL signals with price labels
✓
Sound, Popup, Mobile push and Email alerts
Secure checkout with PayPal
📈 See It in Action
Here is the idea in one picture. Price sits inside the bands, then a candle closes below the lower band and the indicator prints a SELL. Later, a candle closes above the upper band and a BUY appears. The candles change color with every new regime, so the story of the trend is always clear.
Live Chart Screenshots
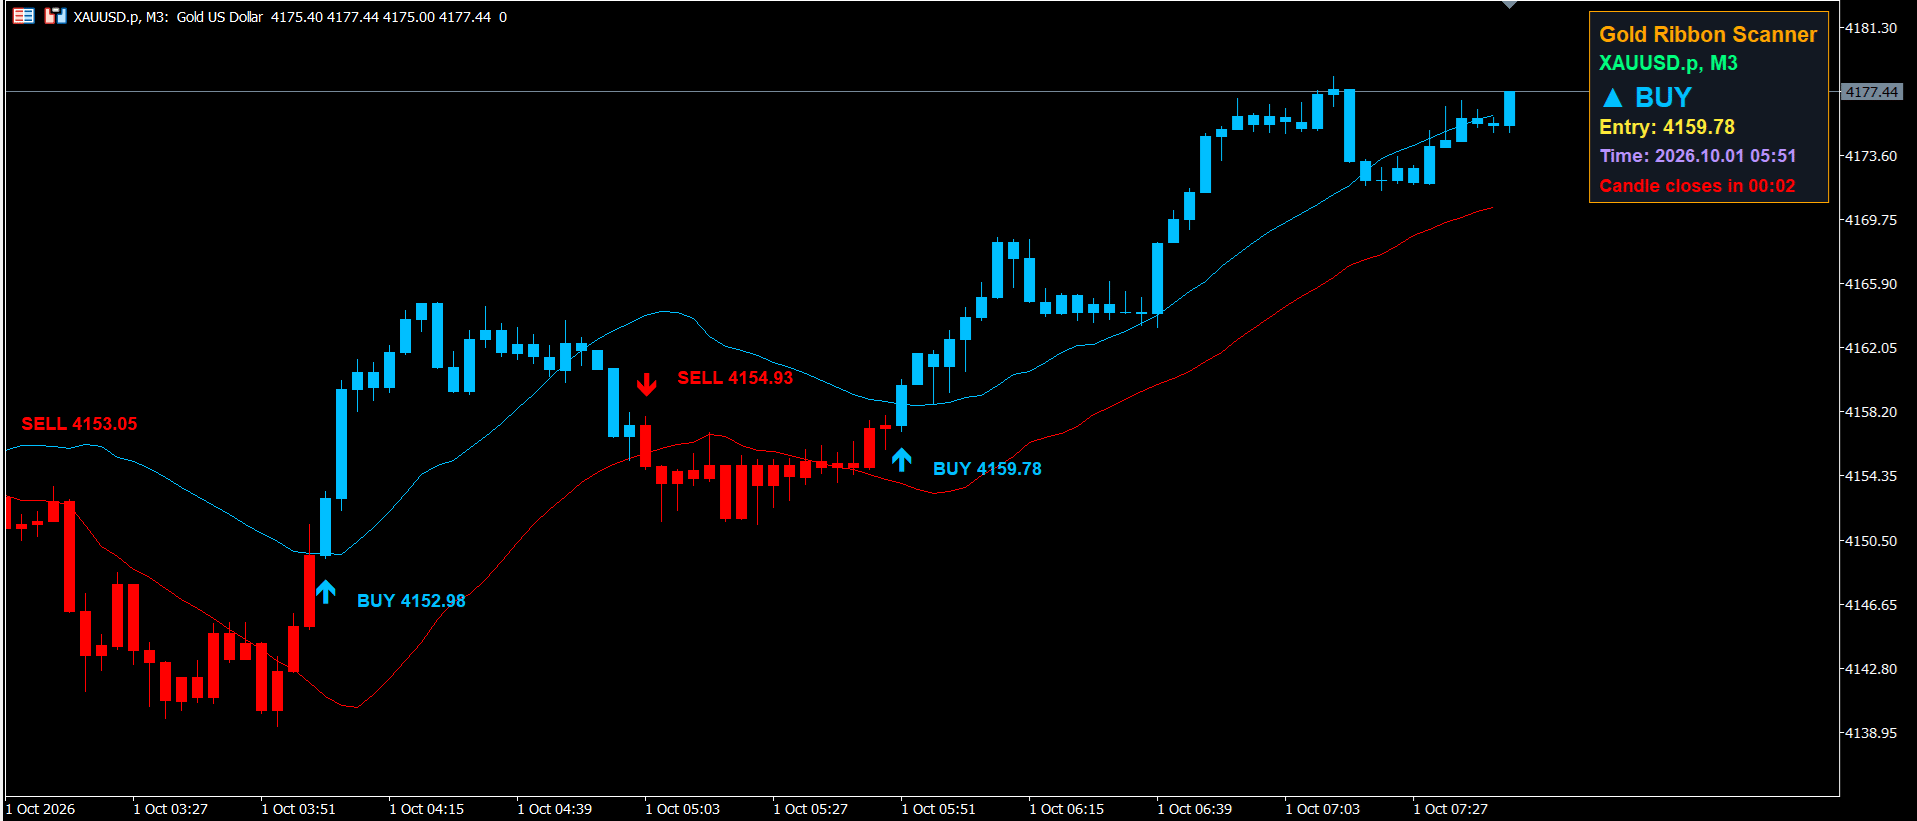
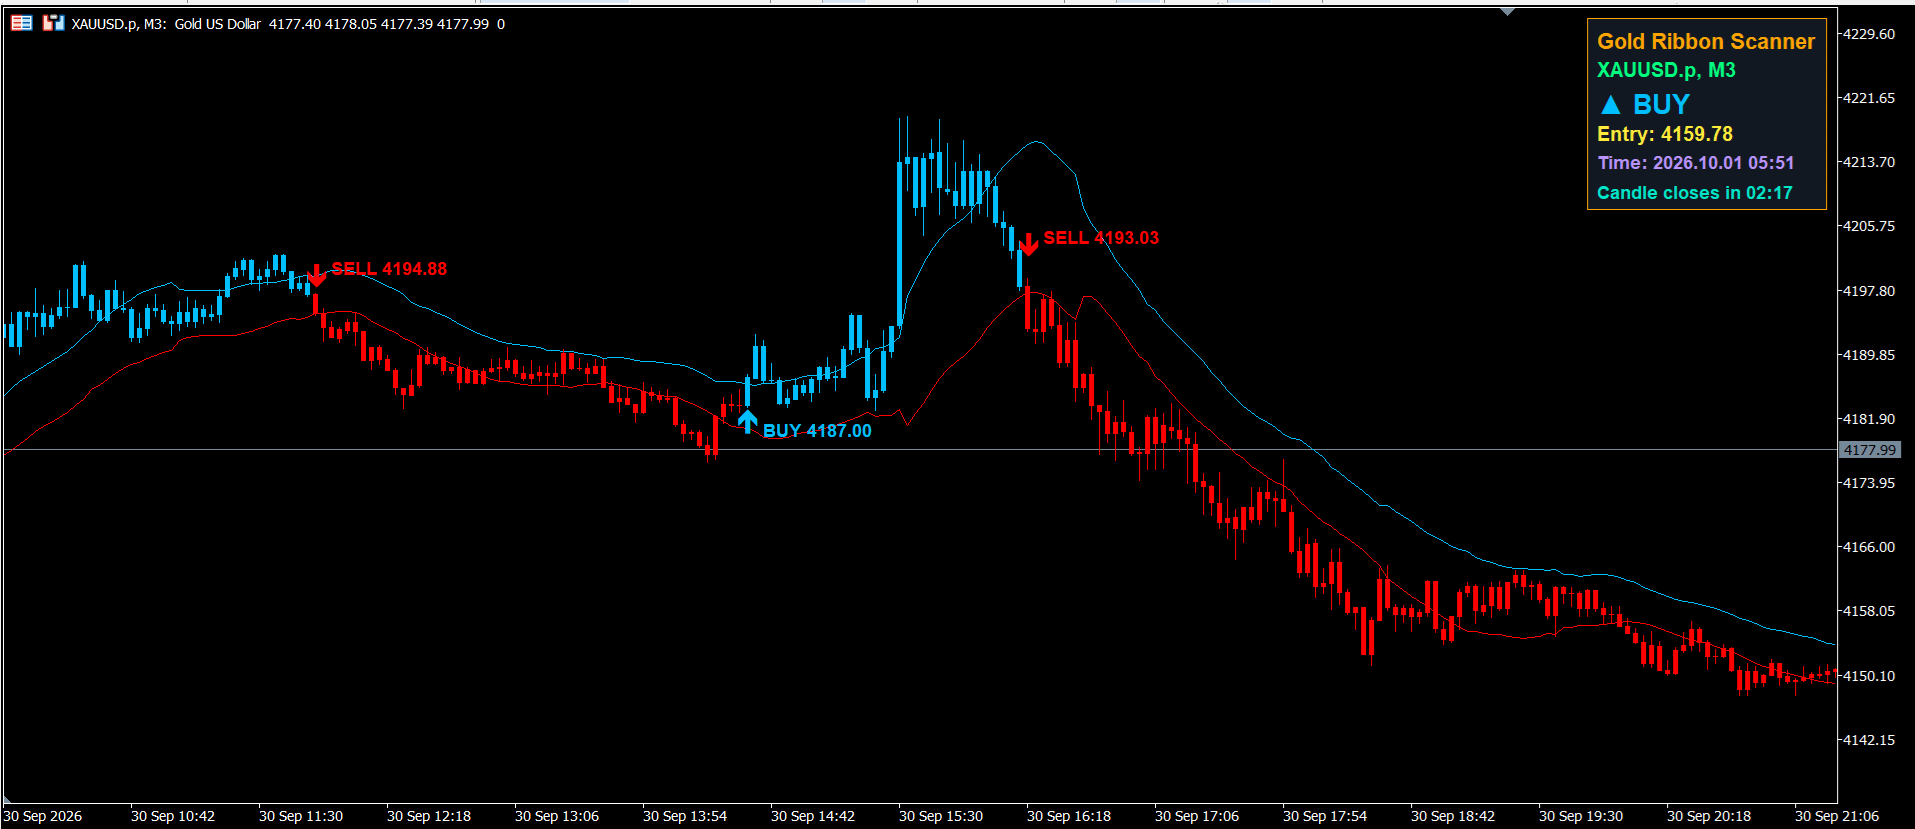
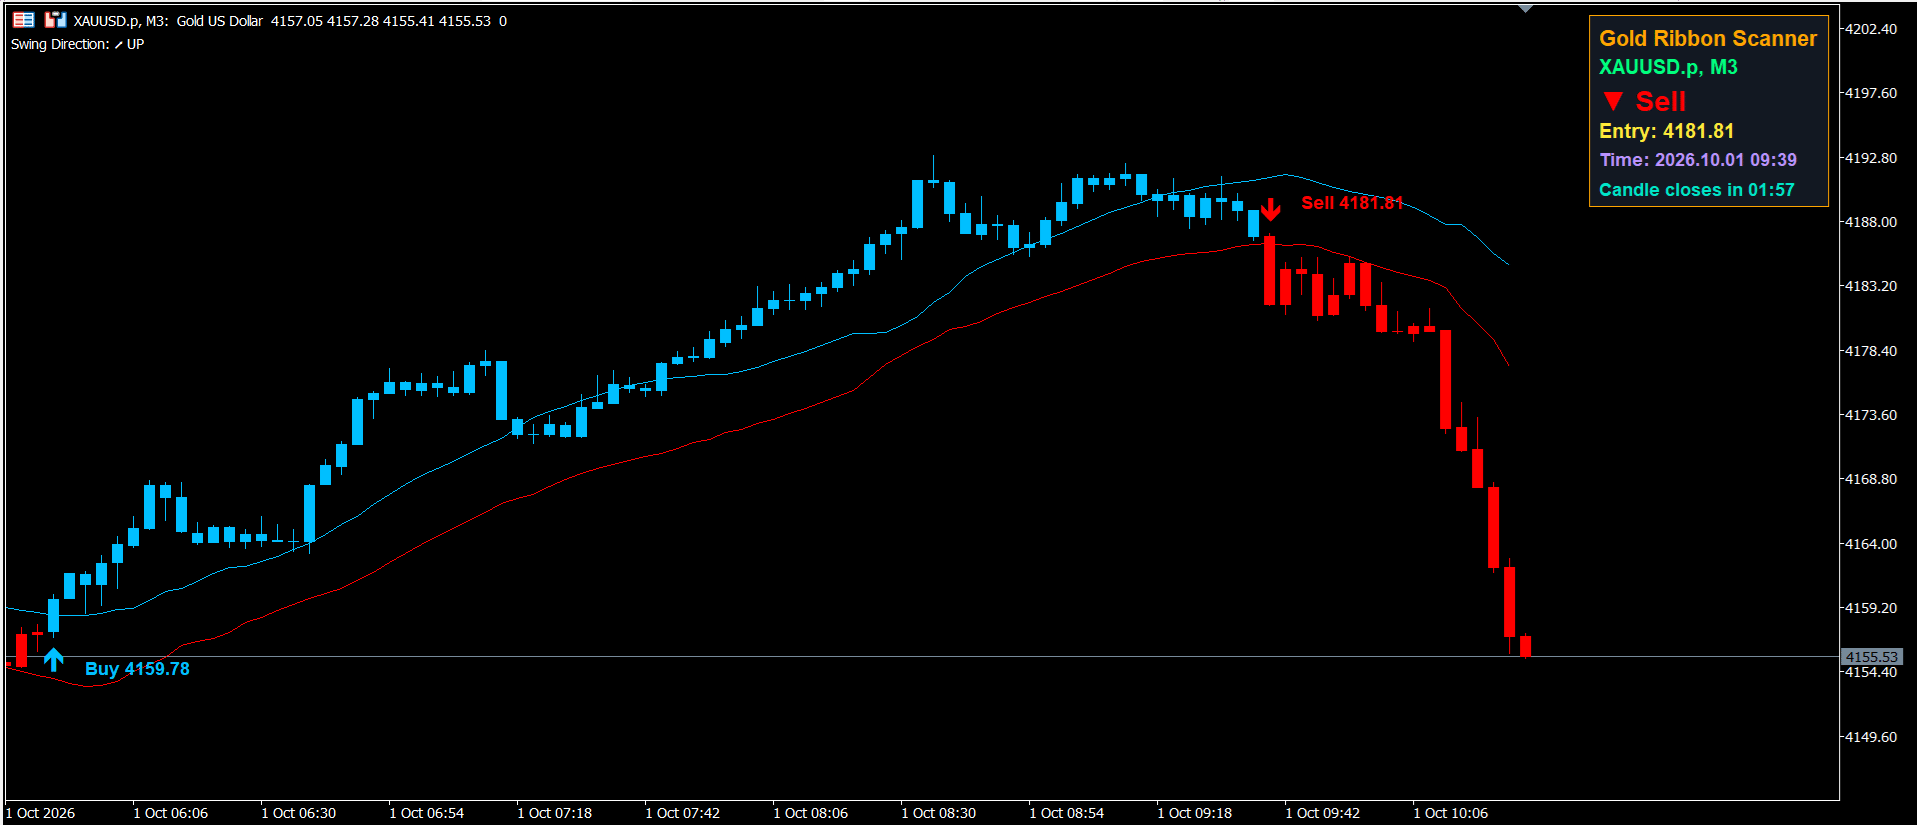
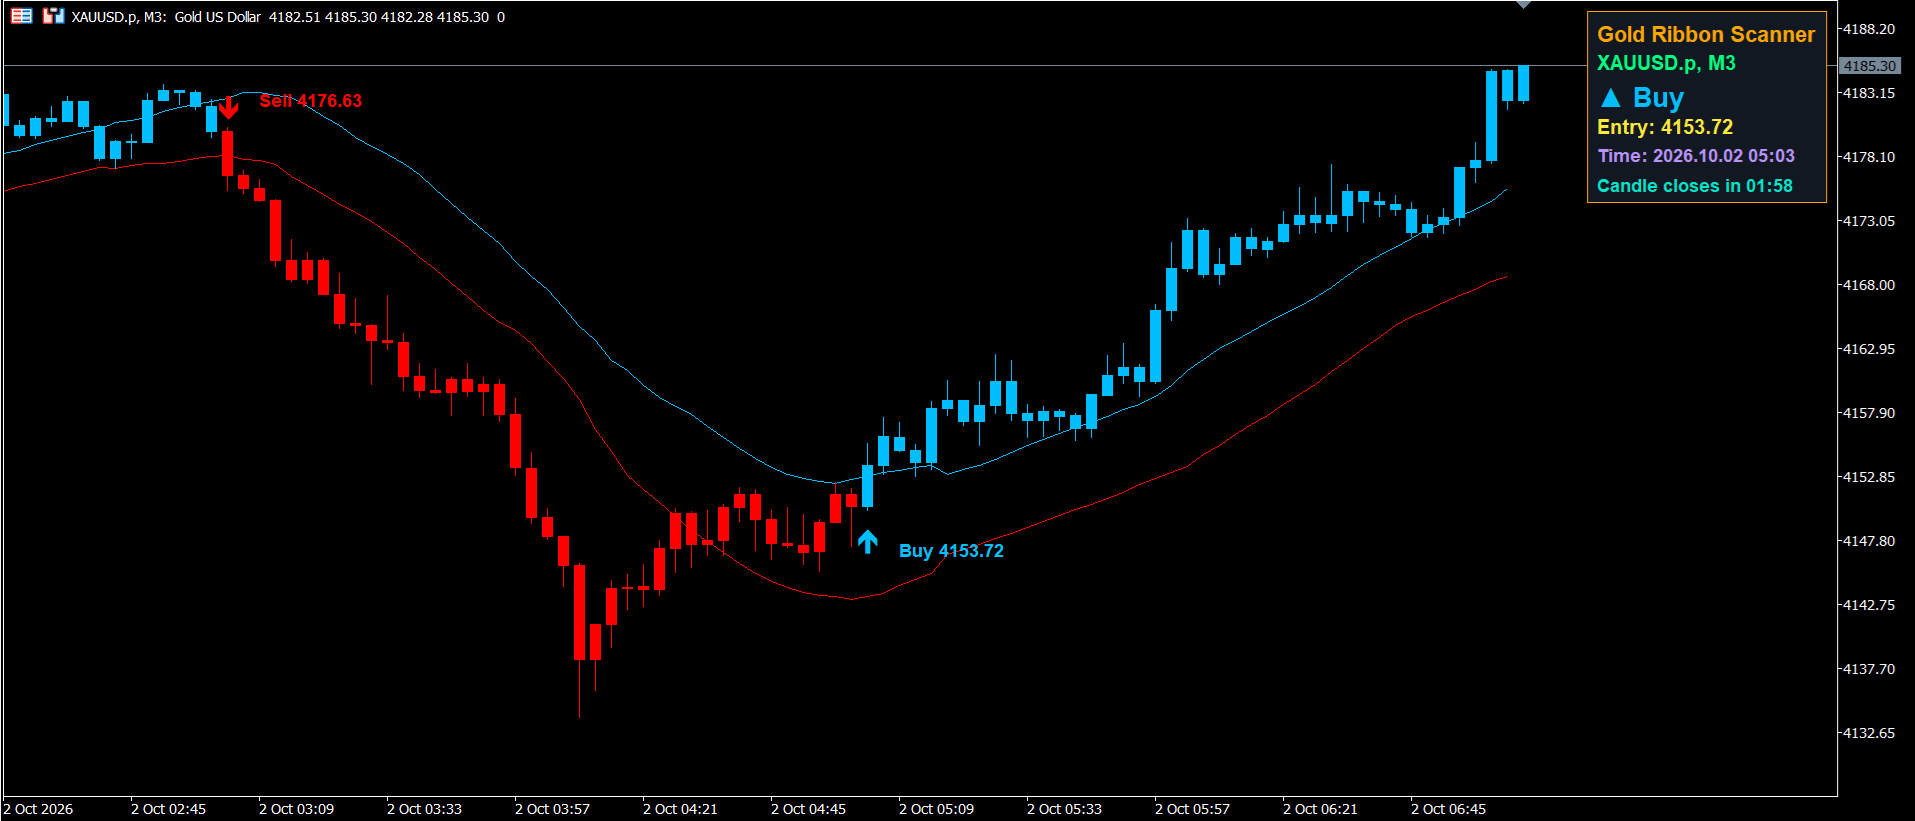

Use the arrows or swipe to see more. Tap or click any screenshot to view it full size.
⚙ How It Works in 5 Simple Steps
1
It studies the market mood. The indicator measures volatility and recent price movement, then decides how fast the trend line should react.
2
It filters out the noise. A momentum-weighted filter gives more power to strong moves and less to tiny, meaningless ones.
3
It builds the two bands. The upper and lower bands are placed around the trend line using recent volatility.
4
It waits for a real breakout. A candle must close above the upper band for a bullish regime, or below the lower band for a bearish one.
5
It signals only when the trend flips. You get one clear arrow at the turning point, not a pile of repeated arrows in the same direction.
👁 Read the Chart in Seconds
Blue candles: bullish regime. Buyers are in control.
Red candles: bearish regime. Sellers are in control.
Up arrow below price: a BUY signal, with its price beside it.
Down arrow above price: a SELL signal, with its price beside it.
Good to know
The signal price is the closing price of the signal candle. Your real entry may be slightly different because the market keeps moving. The candle that is still forming uses the color of the last confirmed regime.
📋 Your Smart Signal Box
A small panel sits in the top-right corner of your chart and keeps you informed at all times.
Gold Ribbon Scanner
XAUUSD, M3
▲ BUY
Entry: 4153.72
Time: 2026.10.02 05:03
Candle closes in 00:36
1
Symbol and timeframe: always know which chart you are looking at.
2
Latest signal: BUY in blue or SELL in red, so the current direction is obvious.
3
Entry price and time: the exact price and time of the last signal candle.
4
Candle countdown: see how long until the candle closes. It turns red in the last 10 seconds, a perfect heads-up before a possible signal.
🔔 Never Miss a Signal
You do not have to stare at the screen all day. When a signal candle closes, the indicator can alert you once, in four different ways. It never fires alerts when you first load the chart.
Sound Alert
A clear sound plays the moment a new signal is confirmed.
Popup Alert
A message window opens right inside MetaTrader 5.
Mobile Push
Get the signal on your phone through the MetaTrader mobile app.
Email Alert
Receive the symbol, timeframe, price, and time in your inbox.
Tip
For push and email alerts, first add your MetaQuotes ID and email details in MetaTrader 5 under Tools > Options.
🚀 Get Started in 5 Easy Steps
1
In MetaTrader 5, click File > Open Data Folder.
2
Open MQL5 > Indicators and paste the indicator file there.
3
Open MetaEditor, compile the file, and make sure there are no errors.
4
Back in MetaTrader 5, right-click Navigator > Indicators and choose Refresh.
5
Drag Gold Ribbon Scanner onto your chart. Bands, colored candles, and the signal box appear right away.
💡 Trade Smarter With These Tips
1
Practice first. Try the indicator on a demo account and see how it behaves on your favorite timeframe.
2
Protect every trade. Always use a stop loss and decide how much you can risk before you enter.
3
Respect big news. Gold can move very fast around major news, and spreads can widen.
4
Add your own view. Combine the signals with support and resistance levels for better decisions.
Remember
Trend tools shine when the market moves in a clear direction. In a sideways market, you may see more false signals, so be extra careful.
Warning
No indicator is right every time. Signals appear after the candle closes, so there is always a small delay. Never risk money you cannot afford to lose.
❓ Quick Answers
Does it repaint?
No. Signals use closed candles only, so a signal that has appeared will stay on your chart.
Why does the signal come after the candle closes?
That is how the indicator avoids repainting. It waits for a candle to close outside the band before it confirms the signal.
Can I use it on any timeframe?
Yes. Test a few timeframes and pick the one that fits your trading style.
Why do my normal candles look different?
The indicator draws its own colored candles over the chart. Your original chart colors come back when you remove the indicator.
Can I use it on other symbols?
Yes. It works on price and volatility, so you can test it on other symbols too.
Ready to Trade With a Clearer Chart?
Get Gold Ribbon Scanner today with a Lifetime License for a one-time price of $299.
Risk Disclaimer
This page is for education and information only. It is not financial advice. Trading forex, gold, and other leveraged products carries a high level of risk and may not be suitable for everyone. You can lose some or all of your money. Past results do not guarantee future results. Please trade responsibly and take advice from a licensed professional if you are unsure.