
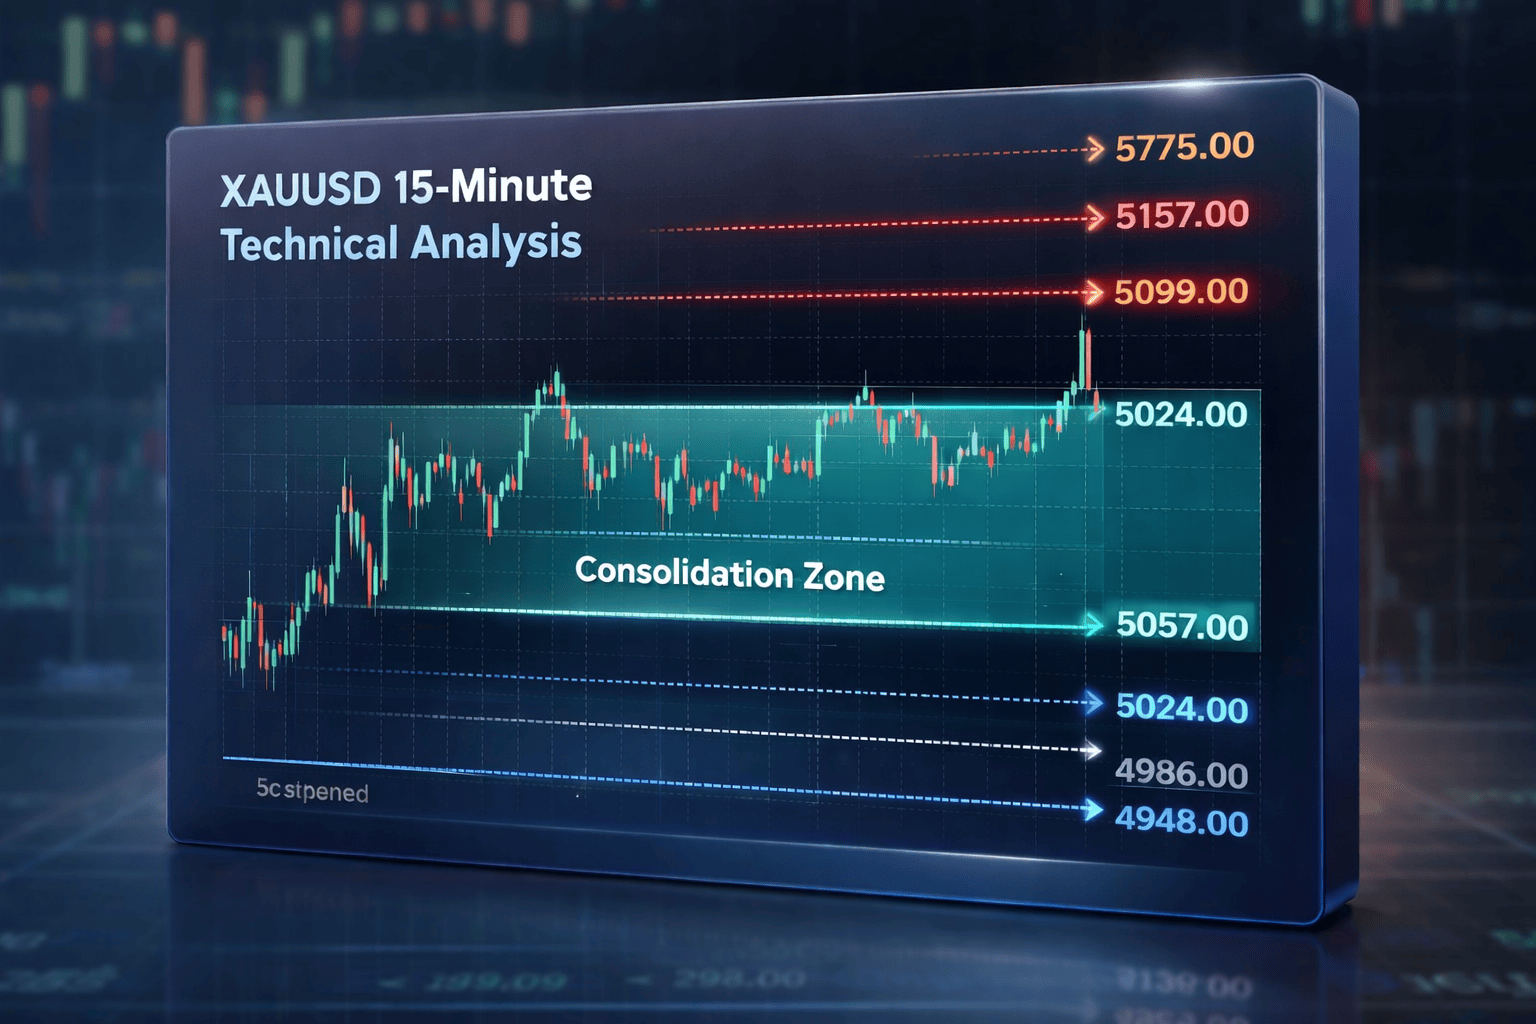
On the 15-minute timeframe, XAUUSD is currently showing a strong bullish move followed by a consolidation phase. Price moved up aggressively from the lower levels and then slowed down near the top area. This type of movement usually indicates that the market is taking a pause after a strong rally and preparing for the next move. At present, the market is not trending strongly in one direction, but the overall structure still favours buyers. The current trading price is around 5057.00, which is acting as an important intraday balance zone. Price has tested this level several times, showing that both buyers and sellers are active here. When price stays around the same zone for a long time, it usually means the market is waiting for fresh momentum.
From a trend perspective, the short-term trend on the 15-minute chart remains bullish. The market has created higher highs and higher lows from the recent bottom near the 4900.00 area. This confirms that buyers are still in control of the broader intraday trend. However, the speed of the bullish move has slowed down, which suggests that momentum is weakening temporarily. After reaching the high near 5099.00, price failed to continue upward strongly and started moving sideways. This sideways movement is a sign of consolidation. Consolidation after a bullish move is generally healthy and often leads to either a continuation of the trend or a controlled pullback before the next rise.
The overall price structure shows a clear bullish leg followed by a range. The current range is roughly between 5024.00 and 5099.00. This zone is acting as a decision-making area for the market. Buyers are defending the lower part of the range, while sellers are protecting the upper part. The resistance level at 5099.00 is very important. Price has tested this level multiple times but has not been able to close above it with strong candles. As long as price stays below this resistance, upside movement will remain limited. A clean break and close above this level would indicate renewed bullish strength.
Above 5099.00, the next resistance comes near 5137.00. If buyers manage to break and hold above this level, price may extend further toward the 5175.00 zone. These higher levels would only be reached if strong momentum enters the market, usually during the London or US trading session. On the downside, the first important support level is around 5057.00. This level is acting as a short-term equilibrium point. If price holds above this zone, buyers remain comfortable. Below this, the next strong support lies near 5024.00. This level has already shown buying interest and is a key intraday support.
If price breaks below 5024.00 with strong bearish candles, a corrective move toward 4986.00 can be expected. This would be a normal pullback within the bullish trend. A deeper correction could take price toward the 4948.00 area, which aligns with a previous breakout zone. Candlestick behaviour on the 15-minute chart shows smaller candle bodies near the top, with visible wicks on both sides. This indicates market indecision. There is no strong rejection or reversal pattern yet. Such candle behaviour usually appears before a sharp move, especially when the market is approaching a key level.
Momentum analysis based on price action suggests that bullish momentum has slowed but not reversed. The absence of strong bearish candles confirms that sellers are not fully in control. The market is simply pausing after a strong move. From a market psychology point of view, early buyers are booking partial profits, while new buyers are waiting for confirmation above resistance. Sellers are attempting to push price down but are facing strong buying interest near support. This creates a tight range and traps impatient traders.
A bullish breakout scenario will become valid if price closes above 5099.00 on the 15-minute timeframe with a strong candle. In that case, buying momentum may increase, and price could move toward 5137.00 and later toward 5175.00. Follow-through candles will be very important for confirmation. A bearish scenario will come into play if price fails to hold above 5057.00 and breaks below 5024.00. This could trigger a short-term correction toward 4986.00 and possibly 4948.00. Even in this case, the higher-timeframe trend would still remain bullish unless price breaks much lower levels.
For now, the market is best viewed as range bound. The upper boundary near 5099.00 and the lower boundary near 5024.00 define the active trading zone. Trading in the middle of this range carries higher risk due to false signals and low momentum. In the short term forecast, price is expected to remain between 5024.00 and 5099.00 until a clear breakout occurs. Volatility is likely to increase during the London and US sessions. A strong move in either direction is expected once the market exits this range.
Finally XAUUSD on the 15-minute timeframe is bullish but consolidating. The trend remains positive, but patience is required. Waiting for a confirmed breakout with strong candle closure will provide better trading opportunities than guessing the direction inside the range.
