
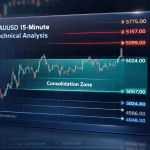
Gold is currently trading around the 5031.00 area on the XAUUSD M15 timeframe. From the chart structure it is very clear that the market is not in a strong trending condition right now. Instead, gold is moving in a narrow range where buyers and sellers are both active, but none of them are strong enough to fully control the market. This type of market behavior usually creates confusion for traders who try to force trades without proper confirmation.
If we look at the recent price action, gold earlier showed a strong bullish move from the lower zone near 4940.00 – 4960.00. That move was sharp and impulsive, which means buyers entered the market with strength. Price moved upward quickly and reached the 5070.00 – 5090.00 zone, where selling pressure started to appear. This area acted as a short-term resistance and price was unable to sustain above it.
After touching that resistance area, gold did not collapse aggressively. Instead, it pulled back slowly and started moving sideways. This tells us something important. When price falls slowly after an impulsive rise, it usually indicates profit booking, not panic selling. Sellers are present, but they are not very aggressive. This keeps the market balanced for some time.
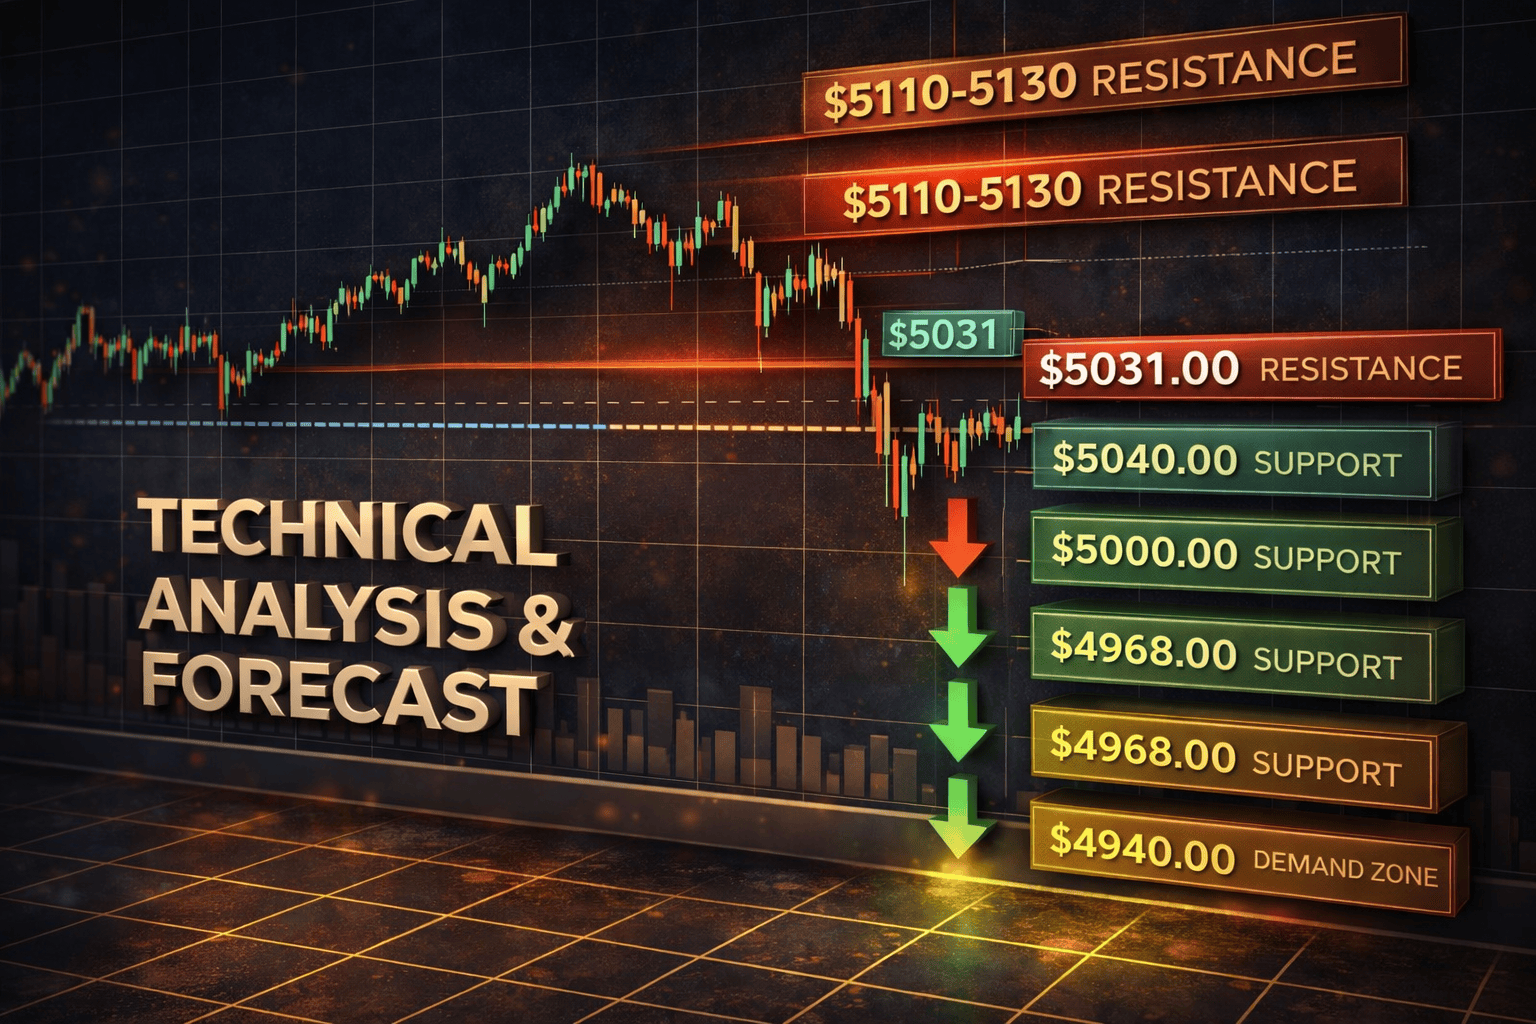
At the moment, the most important price zone is between 5030.00 and 5040.00. This area is acting as a balance point. Price has crossed this zone multiple times, which shows that both buyers and sellers are comfortable trading here. Whenever a price stays around the same level for a long time, it means the market is waiting for a new reason to move, such as volume, news, or a strong technical trigger.
Above the current price, the first noticeable resistance is around 5050.00 – 5070.00. This zone previously rejected price and pushed it downward. If gold moves upward again and fails to close above this resistance with strong candles, it may once again attract sellers. A stronger resistance lies near 5110.00 – 5130.00, which is visible on the chart as a previous high. This area is important because it marks where sellers defended strongly in the past.
Below the current price, immediate support lies around 5000.00 – 5010.00. This is a psychological level and also a technical support where price paused multiple times. If this level breaks with strong bearish candles, the next support will be near 4968.00 – 4985.00. This zone is significant because it acted as a base before the last bullish move. Buyers showed interest there earlier, so the market may react again if price revisits that area.
One important thing to notice is the overall structure of the market. On the M15 timeframe, gold is forming higher lows, but it is failing to form clear higher highs. This creates a compressed structure, also known as a tightening range. When a market stays in such a structure, it usually leads to a strong move later. The direction of that move depends on which side breaks first with strength.
From a momentum perspective, the recent candles show hesitation. Wicks are appearing on both sides, which indicates indecision. Strong trending markets usually show clean candles with small wicks. Here, the presence of long wicks suggests that price is being rejected from both higher and lower levels. This is another confirmation that the market is currently in a neutral phase.
Volume behaviour also supports this view. During the earlier bullish push, volume increased, but during the sideways movement, volume has reduced. This is normal behaviour. Markets often move fast first and then slow down while participants wait for confirmation. This phase is dangerous for impatient traders but very useful for disciplined traders who wait for structure confirmation.
From a broader perspective, gold is still holding above the 4950.00 – 4980.00 demand zone. As long as price stays above this zone, the medium-term bullish bias is not broken. However, being bullish does not mean price will go up in a straight line. Corrections, consolidations, and false moves are part of the process.
If price breaks below 5000.00 and closes strongly below 4980.00, it would signal that buyers are losing control in the short term. In that case, deeper retracement toward 4940.00 – 4920.00 becomes possible. Such a move would still be considered corrective unless price starts forming lower highs consistently.
On the other hand, if gold manages to break and hold above 5070.00 with strong M15 closes, then the market may attempt to revisit the 5110.00 – 5130.00 area. A clean break above that zone would shift the short-term structure back into a bullish continuation phase.
It is very important to understand that this market is currently not suitable for emotional or revenge trading. The best trades usually come after the market shows its intention clearly. Right now, gold is sending mixed signals, and that is completely normal. Not trading is also a valid trading decision in such conditions.
Another key observation is the repeated rejection around 5040.00. This tells us that this level is being watched by large participants. When institutions are active at a certain level, price tends to respect it until a strong reason appears to break it. Traders should always respect such zones rather than forcing assumptions.
From a technical analysis point of view, patience is the biggest advantage here. Waiting for a clear breakout or breakdown will reduce unnecessary losses. Sideways markets are designed to trap impatient traders and reward disciplined ones.
In summary, gold on the XAUUSD M15 chart is currently in a consolidation phase after a bullish impulse. Price is moving between 5000.00 support and 5070.00 resistance, with 5030.00 – 5040.00 acting as the equilibrium zone. Until price breaks out of this range with strength, the market is expected to remain volatile and directionless.
The overall structure does not show panic selling or strong distribution. This means the market is healthy, just undecided. Future movement will depend on how price reacts at the key levels mentioned above. Traders who focus on structure, confirmation, and patience will have a better chance of aligning with the next meaningful move. Gold always rewards those who wait for clarity. The chart is not confusing; it is simply asking for patience.