

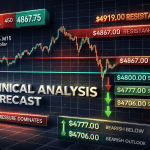
Gold is currently trading near $4821.00 on the XAUUSD M15 chart. From the overall price behaviour shown in the screenshot the short term market structure is clearly bearish. Earlier gold made a strong upward move and reached close to $5097.00, but after that high the buying momentum started to weaken. Price failed to hold at higher levels and strong selling pressure appeared. This rejection from the upper zone indicates that sellers were active and buyers were unable to push the market further up. After the rejection the market started forming lower highs and lower lows which is a clear sign of trend weakness on the M15 timeframe.
As price moved down from the top area it broke below the important support level near $4958.00. This breakdown changed the market sentiment. What was earlier acting as support became resistance. When gold tried to move up again sellers entered near this zone and pushed price lower. This type of price action confirms that the control has shifted from buyers to sellers. The structure after the breakdown is not random. It shows a classic bearish continuation pattern where price makes a pullback and then continues lower.
Currently gold is trading below $4889.00, which is a very important intraday resistance level. Earlier this level supported the price multiple times, but once it was broken price failed to recover above it. Every attempt to move above $4889.00 has been rejected. This tells us that sellers are defending this area strongly. As long as price remains below $4889.00, the bearish bias remains valid and upside moves should be treated as corrective pullbacks rather than trend reversals.
On the downside the nearest support zone lies between $4800.00 and $4780.00. Price has reacted around this area before, so buyers may attempt to slow down the fall here. However support does not mean the market will automatically reverse. If price breaks and closes below $4800.00 with strong bearish candles, then the probability of further downside increases significantly. In that case gold may move toward $4750.00, which is the next visible intraday support level. If selling pressure remains strong, an extended move toward $4680.00 is also possible, as this zone was the origin of the previous bullish move.
Candlestick behaviour on the M15 chart supports the bearish view. Near resistance levels we can see long upper wicks which show rejection. Near the current price area candles are smaller which suggests temporary consolidation. This type of consolidation after a decline often acts as a pause before the next move. If a strong bearish candle appears and closes below $4800.00, it will confirm continuation to the downside. On the other hand, if buyers manage to defend this zone and create strong bullish candles, a short-term corrective move toward $4889.00 may happen, but this would still be considered a pullback unless price breaks and holds above $4958.00.
From a trend perspective the short-term trend on M15 has shifted from bullish to bearish. The sequence of lower highs, lower lows, and failed bullish recoveries confirms this shift. Traders should be careful not to assume reversal too early. Many traders get trapped by small bullish candles inside a bearish trend. The safer approach is to wait for clear confirmation near key levels and trade in the direction of the dominant structure.
In summary gold is trading near $4821.00 with bearish pressure dominating the M15 timeframe. The area near $4889.00 is acting as strong resistance, while $4800.00 is the immediate support. As long as price stays below resistance the probability favours further downside. A break below $4800.00 may lead to $4750.00 and possibly $4680.00. Any upward move without a strong breakout should be treated as a corrective pullback. Traders should maintain proper risk management and avoid emotional decisions in this volatile market.
