
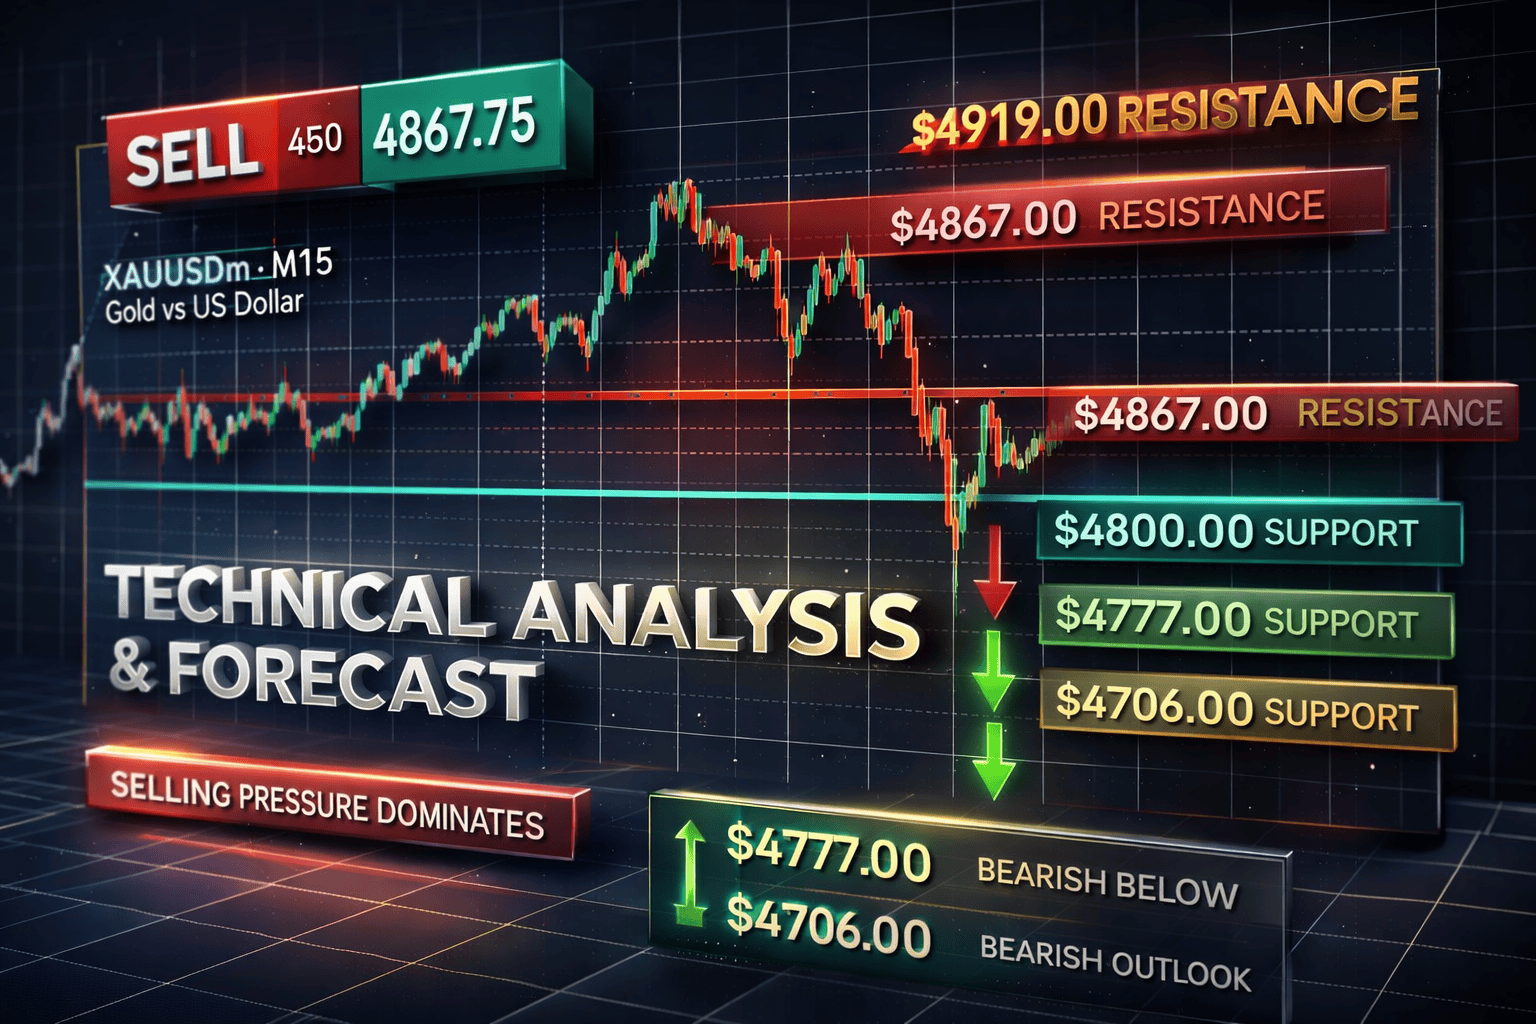
Gold is currently trading near $4867.00 on the XAUUSD M15 chart. From the price action visible in the screenshot the market is still moving in a weak and unstable structure. Earlier gold tried to move higher and formed a short-term top near $5062.00, but that bullish attempt failed quickly. After that rejection strong selling pressure entered the market and price started falling sharply. This fall was not slow or corrective in nature, rather it showed aggressive bearish momentum, which confirms that sellers were dominant during that phase.
After the strong drop gold moved down toward the $4706.00 area where some buying interest appeared. This zone acted as a temporary support and price bounced from there. However this bounce did not show strong bullish strength. Instead of forming higher highs the market started moving sideways. This type of sideways movement after a strong fall usually indicates consolidation rather than reversal. It suggests that sellers are taking a pause and buyers are not confident enough to push price much higher.
At the moment price is trading around $4867.00, which is acting as an important intraday balance level. This level was previously a support and resistance multiple times. Now price is struggling to move clearly above it. Candles around this zone are small and mixed which shows indecision. This behaviour indicates that the market is waiting for fresh volume to decide the next direction. In such conditions false breakouts are very common.
On the upside the nearest resistance lies near $4919.00. This level rejected price earlier and sellers defended it strongly. If gold moves up from the current level and fails again near $4919.00, then selling pressure may reappear. A stronger resistance zone exists near $4991.00, where previous bearish moves started. As long as price remains below these resistance levels the overall short-term bias remains bearish.
On the downside the immediate support is located near $4800.00. If price breaks below this level with a strong bearish candle then the probability of a move toward $4777.00 increases. Below that the next major support is near $4706.00, which was the recent low. If this low is broken then further downside toward $4635.00 cannot be ruled out. This would confirm continuation of the bearish trend on the M15 timeframe.
From a market structure point of view gold is still forming lower highs and lower lows. Even though price bounced from the recent low the recovery lacks strength. There is no clear bullish pattern such as higher highs or strong impulsive candles. This suggests that the current upward movement is only a corrective pullback inside a bearish structure. Traders should be careful not to mistake this consolidation for a full trend reversal.
In conclusion gold at $4867.00 is trading in a fragile zone where direction is not yet confirmed. Below $4919.00 the market remains weak and vulnerable to further selling. A break below $4800.00 may open the path toward $4777.00 and $4706.00. Only a strong and sustained move above $4991.00 would change the short-term bearish outlook. Until then selling on rejection and trading with confirmation remains the safer approach on the M15 timeframe.
