
Gold (XAU/USD) remains one of the most actively traded assets in the global financial market, and the current technical structure continues to attract significant attention from traders and investors. During the recent trading sessions, gold experienced a strong bullish recovery from the major swing low area around 4,366 and successfully advanced toward the 4,595 resistance region before facing renewed selling pressure. The rejection from that resistance zone has created a corrective structure on lower timeframes, causing market participants to closely monitor whether the current pullback is simply a healthy correction within a broader bullish recovery or the beginning of a deeper bearish reversal.
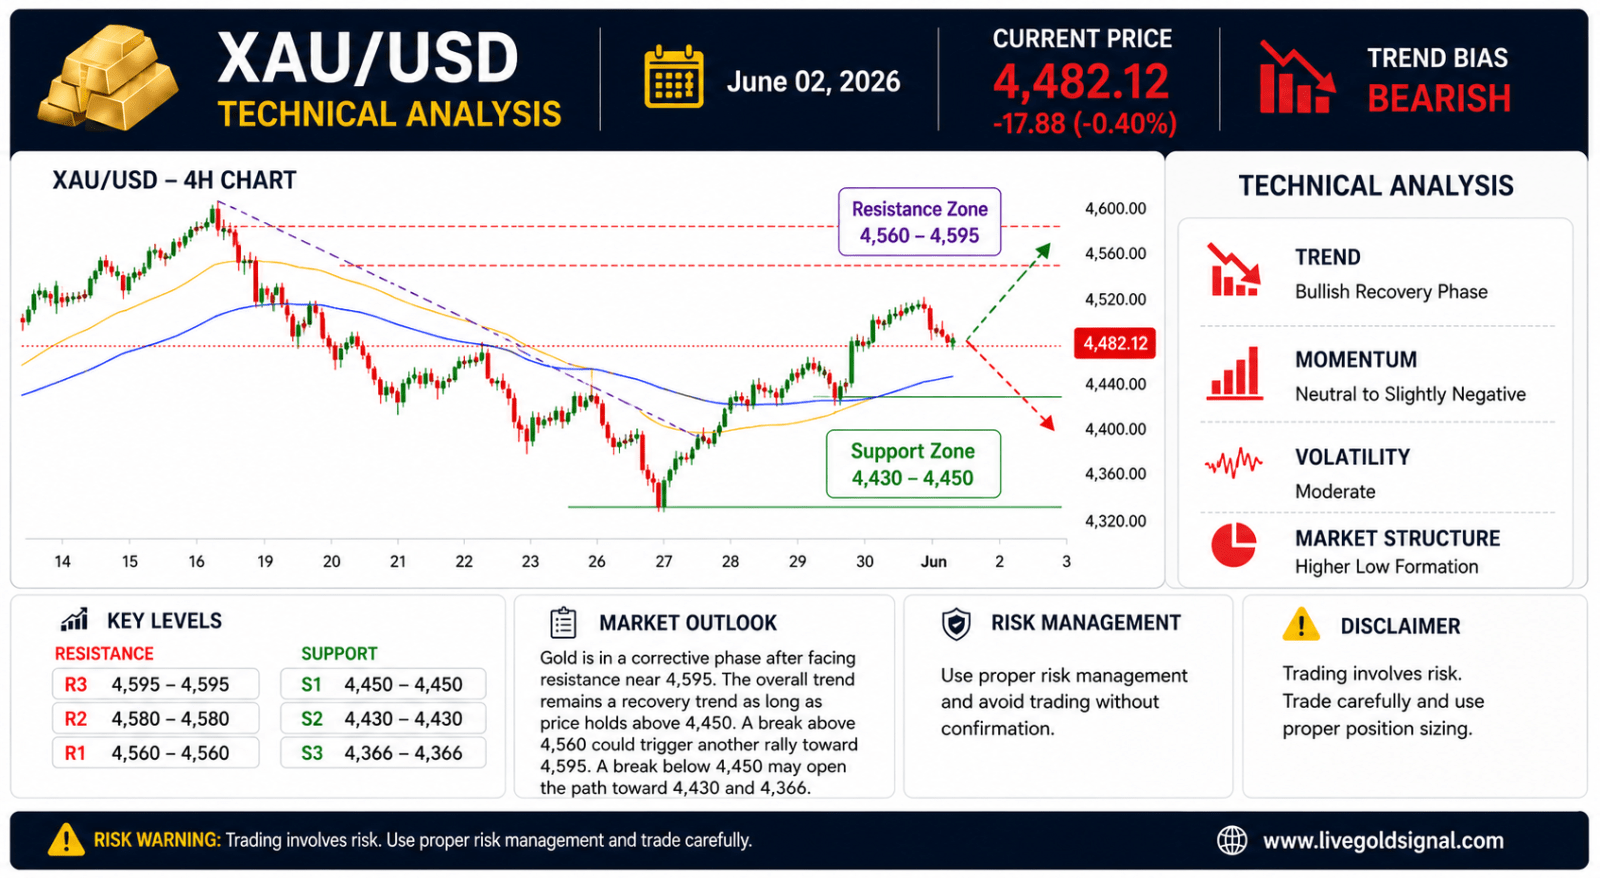
Looking at the current chart structure, gold remains trapped between a major support zone near 4,450–4,430 and an overhead resistance area around 4,560–4,595. Price action over the last several sessions shows increasing volatility, with both buyers and sellers actively defending key levels. The market has recently transitioned from an aggressive bullish impulse into a consolidation and corrective phase. Such behavior is often observed after a sharp directional move when traders begin taking profits while new participants wait for confirmation before entering fresh positions.
| Market Condition | Current Status |
|---|---|
| Primary Trend | Bullish Recovery Phase |
| Short-Term Trend | Corrective Bearish |
| Momentum | Neutral to Slightly Negative |
| Volatility | Moderate |
| Market Structure | Higher Low Formation |
Price Structure Analysis
The most important technical development visible on the chart is the formation of a significant higher low around the 4,366 region. This area served as a strong support base where buyers aggressively entered the market and reversed the previous downtrend. Following that reversal, gold rallied sharply and eventually reached the 4,595 resistance area. Such a move indicates that institutional buying interest remains present in the market.
However, despite the strong recovery, the market failed to maintain bullish momentum above the resistance zone. Sellers emerged near the swing high and pushed prices lower, creating a corrective decline. The current price action therefore represents a battle between profit-taking sellers and trend-following buyers. From a structural perspective, the market remains constructive as long as prices continue trading above the major support region established after the recovery rally. A sequence of higher lows remains visible on the chart, which is generally considered a bullish characteristic. Nevertheless, traders should remain cautious because a decisive break below support could significantly alter the market outlook.
Support And Resistance Analysis
Support and resistance zones continue to define the short-term trading environment. These levels are likely to determine the next major directional move for gold.
| Resistance Levels | Importance |
|---|---|
| 4,595 | Major Swing High Resistance |
| 4,580 | Short-Term Selling Zone |
| 4,560 | Immediate Resistance |
| Support Levels | Importance |
|---|---|
| 4,450 | Immediate Support |
| 4,430 | Strong Technical Support |
| 4,366 | Major Swing Low Support |
The 4,595 area remains the most important resistance on the chart. This level marks the recent swing high and the point where the bullish rally lost momentum. Any successful breakout above this area could trigger another wave of buying activity and potentially open the path toward higher targets. On the downside, the 4,450 support zone remains critical. A sustained break below this level could increase bearish pressure and expose deeper support areas around 4,430 and 4,366.
Trend Analysis
Trend analysis suggests that the broader recovery trend remains intact despite the recent correction. The rally from 4,366 to 4,595 established a strong bullish leg, demonstrating that buyers remain capable of generating significant upward momentum. The current decline appears corrective rather than impulsive, which often indicates that the primary trend has not yet been invalidated. For the bullish scenario to remain dominant, buyers must successfully defend higher support zones and eventually reclaim control above 4,560. A breakout above 4,595 would provide additional confirmation that the broader uptrend remains active. Conversely, if sellers manage to break below 4,430 and sustain trading beneath that level, the probability of a deeper bearish correction would increase substantially.
Momentum Analysis
Momentum indicators currently reflect a neutral-to-negative environment. The strong bullish impulse observed during the recovery phase has weakened, and recent candles indicate reduced buying pressure. Momentum oscillators would likely show declining readings compared with the levels observed during the rally toward 4,595. This loss of momentum does not automatically imply a trend reversal. Markets frequently experience temporary momentum slowdowns before resuming their primary direction. Traders should therefore focus on price action confirmation rather than relying exclusively on momentum indicators.
Volume Analysis
Volume behavior remains an important factor in assessing the quality of current price movements. The rally from the major swing low was accompanied by strong participation, which helped validate the bullish recovery. However, volume has become less aggressive during the current consolidation phase. If gold approaches resistance levels with increasing volume, it would strengthen the probability of a bullish breakout. Conversely, elevated selling volume near support could signal growing bearish control and increase the likelihood of further downside movement.
Market Psychology
Market psychology currently appears balanced between optimism and caution. Buyers remain encouraged by the strong rebound from the 4,366 low, while sellers view the rejection from 4,595 as evidence that significant resistance remains overhead. This conflict between buyers and sellers is creating a consolidation environment characterized by overlapping candles and reduced directional conviction. Such conditions often precede significant breakout movements once one side gains control. Institutional traders are likely monitoring key technical levels while waiting for fresh catalysts. Retail traders should avoid emotional decision-making and instead focus on objective price action signals.
Bullish Scenario
The bullish outlook remains valid while price holds above key support zones. If buyers regain momentum and push gold above 4,560, attention would shift toward the major resistance region around 4,595. A confirmed breakout above that level could attract additional buying interest and potentially initiate another upward expansion phase. Under this scenario, traders may expect stronger bullish sentiment, improved momentum readings, and renewed participation from trend-following market participants.
Bearish Scenario
The bearish case becomes stronger if sellers maintain pressure and force price below the 4,450 support zone. Such a development would indicate weakening bullish control and could trigger additional downside toward 4,430 and eventually the major swing low area around 4,366. A decisive breakdown below those supports would significantly damage the recovery structure and shift market sentiment toward a more bearish outlook.
Final Technical Outlook
The overall technical picture for XAU/USD on June 02, 2026 remains cautiously constructive despite the recent correction. The strong recovery from the 4,366 swing low demonstrates that buyers are still active, but the rejection from 4,595 confirms that major resistance remains in place. The market is currently undergoing a consolidation phase, and the next major move will likely depend on whether buyers can reclaim higher resistance levels or sellers succeed in breaking critical support zones.
For now, traders should closely monitor the 4,560–4,595 resistance region and the 4,450–4,430 support zone. A breakout from either side of this range could determine the next significant directional move in gold. Until then, maintaining disciplined risk management and waiting for confirmation remains the most prudent approach.
