

Gold price analysis today shows that XAUUSD is currently trading near $5067.00 on the intraday chart. This price level is important because it reflects a recovery phase after a strong bearish move. When gold trades around $5067.00, it usually indicates that the market is trying to stabilize after heavy selling pressure. Traders closely watch this level to understand whether gold will continue upward or start another downward move in the coming days.
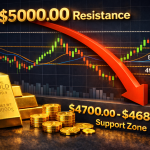
Earlier, gold price was trading above $5300.00 before sellers entered the market aggressively. From the area around $5300.00, gold started falling sharply and moved down toward $4600.00 in a short period. This sharp fall from $5300.00 to $4600.00 clearly shows strong bearish sentiment and panic selling. Such a move often leaves strong resistance levels above and strong support levels below.
When gold price reached the support zone between $4600.00 and $4680.00, buying pressure became visible. Around $4650.00, strong bullish candles appeared, which indicates that large buyers were active in this zone. This support near $4650.00 stopped the price from falling further and acted as a major demand area. Without support at $4650.00, gold could have extended the fall toward $4400.00.
From the demand zone near $4650.00, gold price bounced sharply and moved upward toward $4900.00. The move from $4650.00 to $4900.00 was fast and impulsive, showing that sellers lost control and buyers gained confidence. Such a strong bounce usually confirms that the support zone is reliable and respected by the market.
After reaching the $4900.00 area, gold price did not continue straight toward $5200.00. Instead, price entered a consolidation phase between $4880.00 and $5000.00. This sideways movement near $4950.00 is very important for gold price analysis because it shows balance between buyers and sellers. Markets often pause at such levels before choosing the next direction. As gold price stayed above $4900.00, buyers slowly started to dominate. The price then moved higher and reached the current level near $5067.00. This area around $5067.00 is acting as a short term pivot zone. Holding above $5067.00 increases the probability of a move toward higher resistance levels like $5150.00 and $5200.00.
Gold price holding above the psychological level of $5000.00 is a positive technical signal. The $5000.00 level often acts as a strong support and resistance area in XAUUSD. Since price is currently trading around $5067.00, it suggests that buyers are attempting to build a base above this key round number. If gold price fails to hold above $5067.00, the first support to watch will be around $5000.00. A break below $5000.00 could push gold price toward the next support area near $4900.00. This zone around $4900.00 has historical importance and previously acted as a consolidation area.
If gold price falls below $4900.00, the next downside target could be around $4750.00. A move toward $4750.00 would indicate that bearish pressure is returning. If sellers remain strong, gold may even revisit the major support near $4650.00 again. The support zone near $4650.00 remains extremely important for the coming days. As long as gold price stays above $4650.00, the overall market structure remains a recovery structure. A clear break below $4650.00 would signal a bearish continuation and could open the door for a deeper fall toward $4400.00.
On the upside, if gold price holds above $5067.00 and continues to show bullish price action, the next resistance level will be around $5150.00. This resistance near $5150.00 was previously a selling zone and may attract sellers again when price reaches there. If gold price manages to break above $5150.00 and sustain above it, the next resistance zone will be around $5250.00. The $5250.00 area is a strong resistance because it is close to the previous distribution zone before the major fall started. A sustained move above $5250.00 would indicate strong bullish momentum.
If gold price reaches $5250.00, traders should watch price behaviour carefully. Strong rejection from $5250.00 could lead to a pullback toward $5100.00 or even $5000.00. On the other hand, strong bullish candles above $5250.00 could push gold toward the previous high near $5300.00. The area around $5300.00 remains a major long term resistance. Reaching $5300.00 again would require strong buying interest and positive market sentiment. If gold price fails to break $5300.00, a larger correction may follow.
In the coming days, gold price is likely to trade within a range between $4900.00 and $5200.00. This range behaviour is common after a strong fall and recovery. Traders often buy near $4900.00 and sell near $5200.00 until a clear breakout occurs. If gold price breaks below $4900.00, then bearish momentum may increase and price could move toward $4700.00 and $4650.00. If gold price breaks above $5200.00, bullish momentum may strengthen and price could move toward $5300.00 again.
Based on current XAUUSD technical analysis, buying interest may appear near $4980.00 to $5020.00 if price shows bullish confirmation. Selling pressure may appear near $5180.00 to $5250.00 if price shows weakness in that zone. These support and resistance levels are important for intraday and short term traders. Gold price movements are sensitive to volatility and liquidity. Sudden spikes above $5100.00 or drops below $4950.00 are possible. Even though gold is trading around $5067.00, traders should always wait for confirmation before entering trades.
