
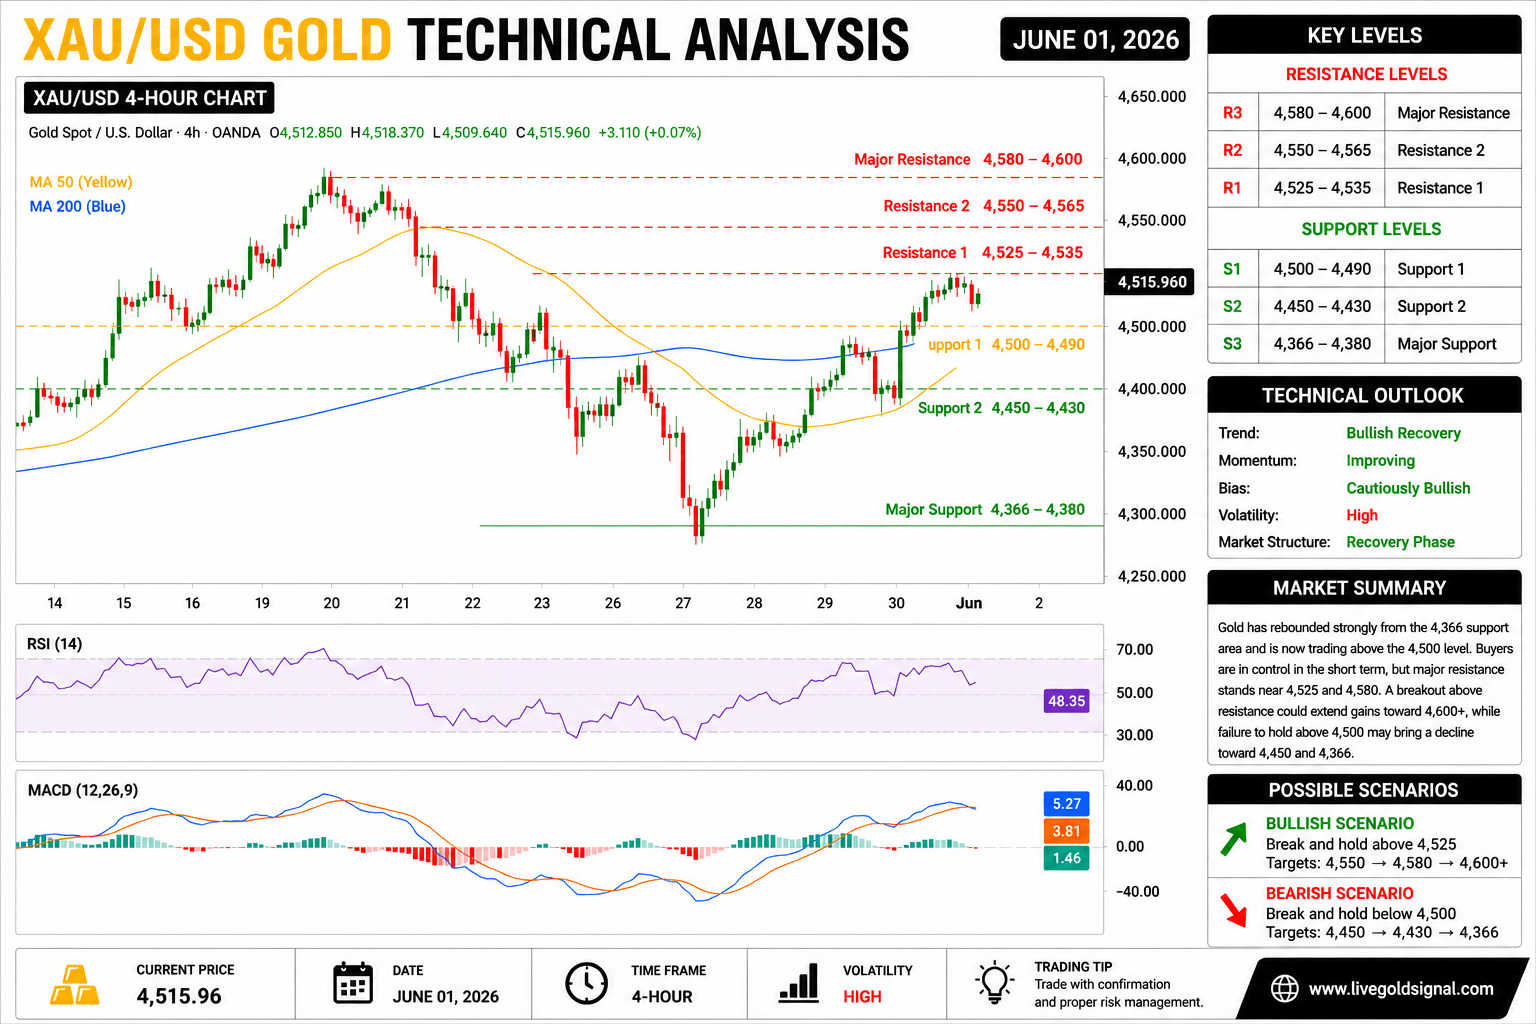
Gold (XAU/USD) started June with a strong recovery attempt after the sharp decline seen during the final sessions of May. Buyers successfully defended the major support zone around 4,366 and pushed the market back above the 4,500 psychological level. Although the broader trend remains corrective after the previous bearish wave, the latest price action indicates that bullish momentum is gradually returning to the market. Traders are now closely watching whether gold can establish a sustained move above the immediate resistance area near 4,525 and challenge the major resistance zone around 4,580.
The recent recovery from the 4,366 support level demonstrates that buyers remain active at lower prices. However, gold is still trading below the important swing high near 4,580, which means the market has not yet fully transitioned into a confirmed bullish trend. Price action over the coming sessions will be critical in determining whether the recent rebound develops into a larger upside movement or remains a temporary correction within a broader consolidation phase.
| Technical Overview | Status |
|---|---|
| Short-Term Trend | Bullish Recovery |
| Medium-Term Trend | Neutral |
| Momentum | Improving |
| Volatility | High |
| Market Structure | Recovery Phase |
Price Action Analysis
The most important development on the chart is the strong rebound from the 4,366 support area. This level acted as a significant demand zone where aggressive buying pressure entered the market. Following the rebound, gold produced a sequence of higher highs and higher lows, indicating a shift in short-term market sentiment. The rally toward the 4,580 region confirmed that buyers were capable of regaining control. However, the market failed to maintain momentum at higher levels and experienced profit-taking pressure near resistance. Despite this pullback, price remains above several important support levels, suggesting that buyers still retain a degree of control.
Current market structure shows that gold is attempting to establish a base above 4,500. As long as this area remains protected, the probability of another upside attempt remains favorable. A sustained break below 4,500 would weaken the bullish recovery scenario and increase the risk of renewed selling pressure.
Trend Structure Assessment
The broader market structure can be divided into three phases. The first phase was the aggressive decline from the 4,580 resistance region. The second phase involved the formation of a significant bottom near 4,366. The third phase, which is currently developing, consists of a recovery movement aimed at reclaiming lost ground. For the bullish trend to gain credibility, gold must continue producing higher swing lows while gradually moving toward higher resistance levels. The recovery structure remains valid as long as support zones continue holding. A break above 4,525 would provide additional confirmation that buyers are strengthening their position.
At present, the market appears to be transitioning from a corrective decline into a stabilization phase. Whether this stabilization evolves into a full bullish reversal will depend on upcoming price action around major resistance levels.
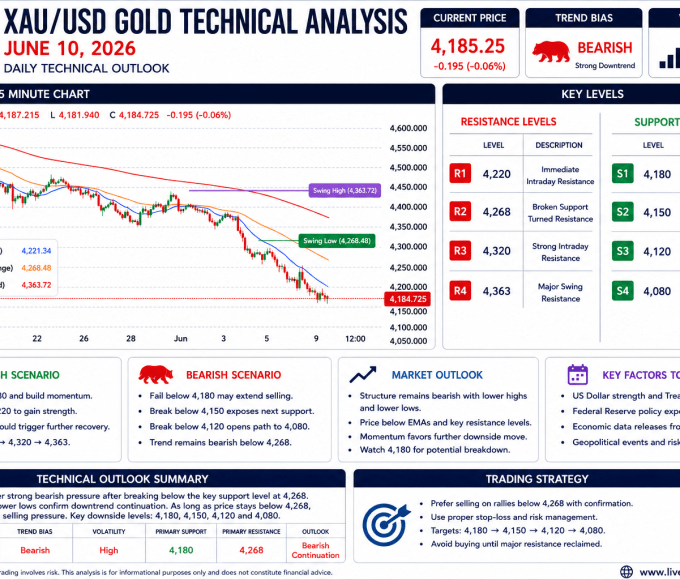
Support And Resistance Levels
| Resistance Levels | Importance |
|---|---|
| 4,525 | Immediate Resistance |
| 4,550 | Major Resistance |
| 4,580 | Swing High Resistance |
| 4,600 | Long-Term Resistance |
| Support Levels | Importance |
|---|---|
| 4,500 | Psychological Support |
| 4,450 | Secondary Support |
| 4,430 | Major Support |
| 4,366 | Critical Swing Low |
Moving Average Analysis
Moving averages are beginning to show signs of stabilization following the recent decline. The shorter-term moving averages have flattened, reflecting reduced bearish momentum. This development often occurs before the market attempts a directional breakout. Price has regained important moving average levels during the recovery phase, indicating improving market sentiment. If gold continues trading above these averages, bullish momentum could strengthen further. Conversely, a return below the moving average cluster would suggest that sellers are regaining control. The interaction between price and moving averages will remain one of the most important technical factors throughout the early sessions of June.
Momentum Analysis
Momentum indicators suggest that selling pressure has weakened considerably compared with previous sessions. The aggressive downside momentum that dominated the market during the decline from 4,580 has gradually faded, allowing buyers to regain confidence. Recent price swings show stronger bullish participation, especially following the successful defense of the 4,366 support area. Momentum remains positive as long as gold maintains higher lows and avoids a breakdown below key support zones. Although momentum is improving, traders should remain cautious because recovery phases can often experience temporary pullbacks before resuming their primary direction.
Volume Analysis
Trading activity increased significantly during the rebound from support, indicating genuine buying interest rather than a weak corrective bounce. Higher volume during recovery movements typically strengthens the credibility of bullish price action. Volume behavior around resistance levels will be especially important. If buyers continue supporting higher prices with strong participation, resistance zones may eventually break. However, declining volume during rallies could indicate fading momentum and increase the risk of consolidation. Current volume characteristics remain moderately supportive for the bullish recovery scenario.
Bullish Scenario
In the bullish case, gold successfully maintains support above 4,500 and gradually advances toward 4,525. A decisive breakout above this level could open the door for further gains toward 4,550 and eventually the major resistance area around 4,580.
Breaking above 4,580 would significantly improve the long-term outlook and could trigger fresh buying interest from institutional traders and momentum participants. Such a move would likely confirm that the recent recovery has evolved into a larger bullish trend. For this scenario to remain valid, buyers must continue defending key support zones and maintain positive momentum.
Bearish Scenario
The bearish scenario becomes more likely if gold fails to hold above 4,500. A breakdown below this psychological support level could trigger renewed selling pressure and expose 4,450 as the next downside target.
Further weakness below 4,450 could encourage sellers to test 4,430 and potentially revisit the critical swing low near 4,366. Such a development would invalidate much of the recent recovery and place the market back into a bearish structure. While this scenario currently appears less probable, traders should remain aware of the risks associated with sharp changes in market sentiment.
Market Outlook
Overall, the technical outlook for XAU/USD on June 01, 2026 is cautiously bullish. The successful defense of the 4,366 support area and the subsequent recovery above 4,500 indicate improving market conditions. Buyers have regained short-term control, but significant resistance remains overhead.
The key battleground for the coming sessions will be the 4,525 to 4,580 resistance zone. A successful breakout would strengthen bullish momentum considerably, while rejection from these levels could result in consolidation or another corrective decline. Until proven otherwise, the market remains in a recovery phase with a slight bullish advantage. Traders should monitor price behavior around major support and resistance levels while maintaining disciplined risk management practices.