
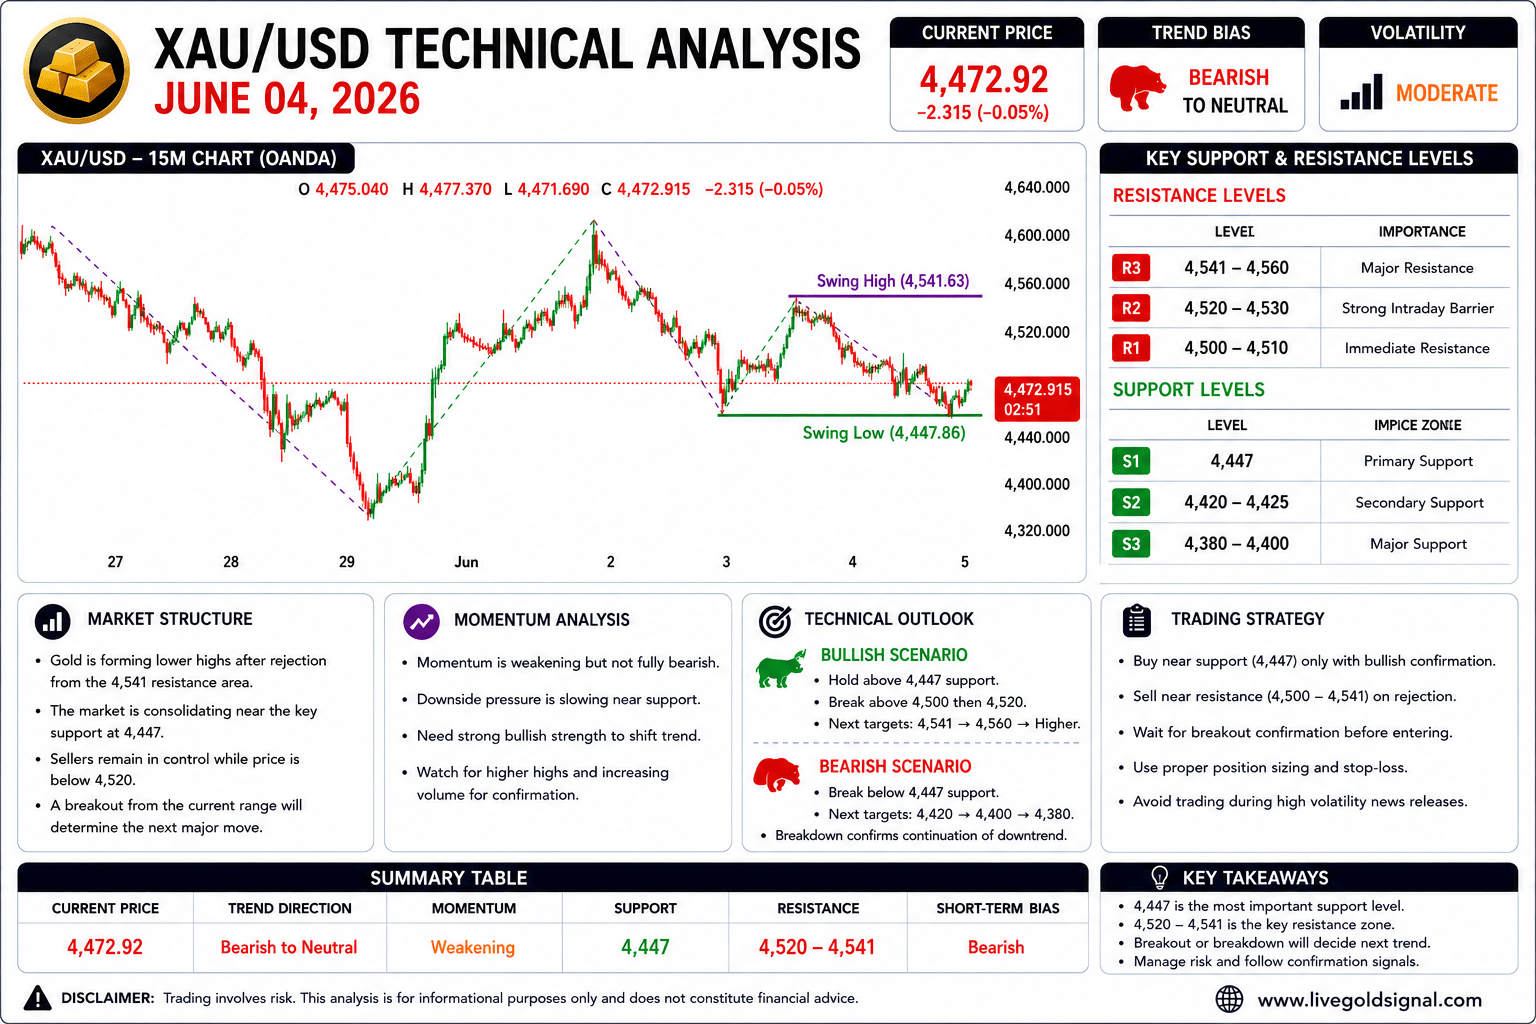
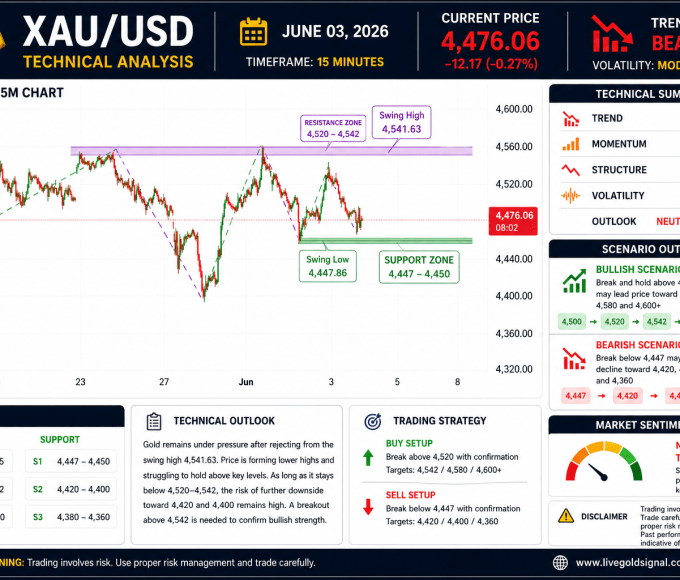
Gold (XAU/USD) continues to trade under selling pressure after failing to sustain momentum above the 4,520 resistance area. The latest price action shows that sellers remain active near higher levels while buyers are attempting to defend the important 4,447 support zone. The market is currently moving inside a corrective bearish structure, and traders are closely watching whether gold can hold above support or extend its decline toward lower levels.
The chart structure indicates that gold remains trapped between a strong resistance zone near 4,520–4,541 and a support area around 4,447. Recent sessions have produced lower highs, which is a classic sign of weakening bullish momentum. Although buyers managed to trigger several short term recoveries from support, each rally has been met with renewed selling pressure. This behavior suggests that market participants remain cautious and that the overall trend is still favoring sellers in the short term.
| Technical Overview | Current Status |
|---|---|
| Trend Direction | Bearish to Neutral |
| Market Structure | Lower High Formation |
| Momentum | Weakening |
| Volatility | Moderate |
| Short-Term Bias | Bearish |
Current Market Structure Analysis
Looking at the broader market structure, gold has created a series of declining swing highs since the rejection from the 4,541 area. This pattern highlights the inability of buyers to regain complete control of the market. Every recovery attempt has been capped by resistance, allowing sellers to maintain pressure.
The support zone around 4,447 remains the most important technical area on the chart. Multiple reactions have occurred from this level, making it a key decision point. If buyers continue defending this area, a corrective rebound could develop toward higher resistance levels. However, a decisive breakdown below support would likely accelerate bearish momentum and expose deeper downside targets.
The market is currently trading close to support, meaning the next directional move could be significant. Traders should monitor price behavior carefully around this region because it will likely determine whether gold enters a fresh bullish recovery phase or continues its downward correction.
Support And Resistance Zones
Support and resistance levels continue to provide the clearest roadmap for traders. The recent consolidation pattern shows that gold is respecting these zones with remarkable precision.
| Resistance Levels | Price Zone |
|---|---|
| R1 | 4,500 – 4,510 |
| R2 | 4,520 – 4,530 |
| R3 | 4,541 – 4,560 |
| Support Levels | Price Zone |
|---|---|
| S1 | 4,447 |
| S2 | 4,420 – 4,425 |
| S3 | 4,380 – 4,400 |
Price Action Analysis
Price action remains one of the most important tools for understanding current market sentiment. The latest candles indicate indecision near support. Several lower wicks are visible around the 4,447 area, suggesting that buyers are still defending this level. However, the inability to produce a strong bullish breakout indicates that confidence remains limited.
Recent bearish swings have been stronger than bullish recoveries, another sign that sellers currently possess the advantage. Until gold can reclaim and hold above 4,520, the market will likely remain vulnerable to additional selling pressure.
The chart also shows a contracting range developing between support and resistance. Such consolidation patterns often precede larger directional movements. Therefore, traders should prepare for increased volatility once price finally escapes this range.
Momentum Analysis
Momentum indicators suggest that bearish pressure is gradually slowing but has not completely disappeared. The pace of declines has eased compared with earlier sessions, which may indicate that sellers are becoming less aggressive. Nevertheless, the absence of strong bullish momentum means that buyers have not yet regained control.
Momentum typically shifts before trend reversals occur. Therefore, traders should watch for stronger bullish candles, higher highs, and increasing buying volume. Until those signals emerge, the market remains vulnerable to further downside movement.
Current momentum conditions support a neutral-to-bearish outlook. The market may continue consolidating before choosing its next major direction.
Bullish Scenario
For bulls to regain control, gold must first defend the 4,447 support zone and establish a series of higher lows. A successful recovery above 4,500 would improve market sentiment significantly and could attract fresh buying interest.
If buyers manage to push price above 4,520 and maintain stability above that level, the next upside target would likely be the 4,541 resistance area. A breakout above 4,541 could open the door toward 4,560 and potentially higher levels in the coming sessions.
A sustained bullish breakout would signal that the recent correction has ended and that the market is ready to resume its broader upward trend.
Bearish Scenario
The bearish outlook remains valid while price stays below major resistance. If gold breaks beneath 4,447 support, selling pressure could increase sharply.
The first downside objective would likely be the 4,420 area. Additional weakness below that zone could expose 4,400 and eventually 4,380. These levels represent important historical support regions where buyers may attempt to re-enter the market.
Failure to defend support would confirm continuation of the bearish structure and increase the probability of deeper declines.
Trading Strategy Considerations
Short term traders may focus on breakout opportunities around key support and resistance levels. Conservative traders may prefer waiting for confirmation before entering positions. Buying near support without confirmation carries risk because a breakdown remains possible.
Similarly, selling near resistance may provide opportunities if bearish rejection patterns appear. Risk management remains essential because gold volatility can increase rapidly following economic news or unexpected market developments.
Position sizing should remain controlled, and stop losses should always be placed according to individual risk tolerance.
Final Technical Outlook
The overall technical picture for XAU/USD on June 04, 2026 remains cautiously bearish. Gold continues trading below key resistance while repeatedly testing the important 4,447 support zone. Market structure still favors sellers due to the formation of lower highs and repeated resistance rejections.
A break above 4,520–4,541 would improve the outlook and could trigger a broader recovery toward 4,560 and beyond. Conversely, a decisive breakdown below 4,447 would likely accelerate selling pressure toward 4,420 and 4,400.
Until a breakout occurs, traders should expect consolidation and range-bound trading between major support and resistance zones. The next confirmed move from this range will likely determine gold’s short-term direction for the coming sessions.