

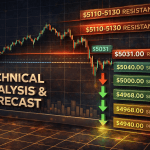
At the moment, XAUUSD on the 15 minute time frame is trading close to 5033.00. This price level is important because it sits in the middle of a recent bullish recovery after a strong decline. To understand where price may go next, we first need to understand where it came from, how buyers and sellers behaved at specific price levels, and which zones are likely to attract reactions again in the future. Earlier, gold experienced a sharp bearish move from the higher region near 5120.00–5150.00. During that phase, sellers were clearly in control, pushing price down aggressively with strong bearish candles. The decline continued until price reached the 4985.00–4990.00 zone. Around this area, selling pressure started to slow down. Instead of continuing lower, price began to show rejection, meaning sellers were no longer confident enough to push the market further down.
From the 4985.00–4990.00 zone, gold created a strong bullish reaction. This move was not slow or weak. Price moved quickly upward, covering more than 40 points in a relatively short time. Such a sharp bounce usually indicates that large buyers stepped into the market. This zone now acts as a major short-term demand area. As long as price stays above 4990.00, this demand zone remains valid. After bouncing from 4990.00, price did not move straight up endlessly. Instead, it paused and created a small consolidation around 5005.00–5015.00. This behaviour is very important. When price consolidates after a strong move, it usually means the market is accepting higher prices. During this phase, weak sellers exit their positions, while buyers slowly build confidence. This consolidation later acted as a base for the next bullish push.
From the consolidation zone near 5010.00, gold pushed higher again and reached the 5040.00–5050.00 area. This area is a known resistance because price reacted from here earlier during the previous bearish move. When price reached this zone again, it started to slow down, showing that sellers are active here. Currently, price is fluctuating around 5033.00, which is slightly below the main resistance zone of 5040.00–5060.00. This tells us that the market is deciding whether it has enough strength to break higher or whether it needs to pull back before another attempt.
If we focus on the bullish scenario first, price must stay above 5010.00. This level represents the most recent higher low on the 15 minute chart. As long as price holds above 5010.00, the short-term market structure remains bullish. In this scenario, price may continue to move sideways between 5020.00 and 5040.00 for some time. This sideways movement would allow buyers to build strength. If buyers manage to push price above 5040.00 with strong bullish candles and good momentum, the next immediate upside target would be 5065.00. This level comes from a previous intraday rejection zone. If price breaks 5065.00 and holds above it, the next bullish target would be 5090.00–5100.00. This zone is psychologically important and also aligns with previous structure on the chart.
If momentum remains strong above 5100.00, price could attempt a move toward 5125.00–5150.00 in the future. However, reaching that area would likely require strong bullish continuation and supportive market sentiment. It would not happen in one straight move and would involve pullbacks along the way. Now let us consider the pullback scenario, which is very normal in any healthy market. If price fails to break 5040.00–5060.00, sellers may push the market down slightly. In that case, price may retrace toward 5020.00 or even 5010.00. A pullback to 5010.00 would still be considered healthy as long as price shows bullish rejection from that area. If buyers defend 5010.00, price could again move upward toward 5040.00 and possibly higher.
The situation becomes more serious for buyers if price breaks below 5010.00 with strong bearish candles. A clean break and close below 5010.00 would indicate that buyers are losing control in the short term. In that case, the next downside target would be 4985.00, which is the previous major demand zone. If price reaches 4985.00 again, this level will be extremely important. If buyers defend 4985.00 once more, price may form a double bottom and bounce again toward 5020.00–5040.00. However, if price fails to hold 4985.00 and breaks below it, the bearish scenario becomes stronger.
Below 4985.00, the next downside targets would be 4960.00 and then 4935.00. These levels are based on previous structure and imbalance zones on the chart. A move below 4960.00 would indicate that the entire bullish recovery from 4990.00 has failed, and the market may attempt to revisit deeper lows. From a broader perspective, the market is currently in a decision zone. Price around 5033.00 is neither extremely bullish nor extremely bearish. It is sitting between strong support at 5010.00 and strong resistance at 5040.00–5060.00. What happens between these levels will define the next clear direction.
If price stays above 5010.00 and slowly grinds higher, the probability of a bullish breakout increases. If price repeatedly fails near 5040.00 and starts making lower highs, the probability of a deeper pullback increases. One important thing to remember is that markets do not move in straight lines. Even if the final direction is upward toward 5090.00 or 5100.00, price may still dip to 5020.00 or 5010.00 before moving higher. Similarly, even if price eventually moves down toward 4960.00, it may first spike toward 5040.00 to trap late buyers.
In conclusion, with the current price around 5033.00, the short-term bias on the 15 minute chart remains bullish above 5010.00. Upside targets are 5065.00, 5090.00, and possibly 5100.00+ if momentum supports it. A break below 5010.00 shifts the bias toward 4985.00, followed by 4960.00 and 4935.00. Until one of these key levels is clearly broken, price is likely to move in a controlled, technical manner based on support and resistance behaviour.
This forecast is based purely on price action, structure, and reaction zones, written to reflect how a real trader reads the chart and plans future movement step by step, level by level, without emotion or guessing.