
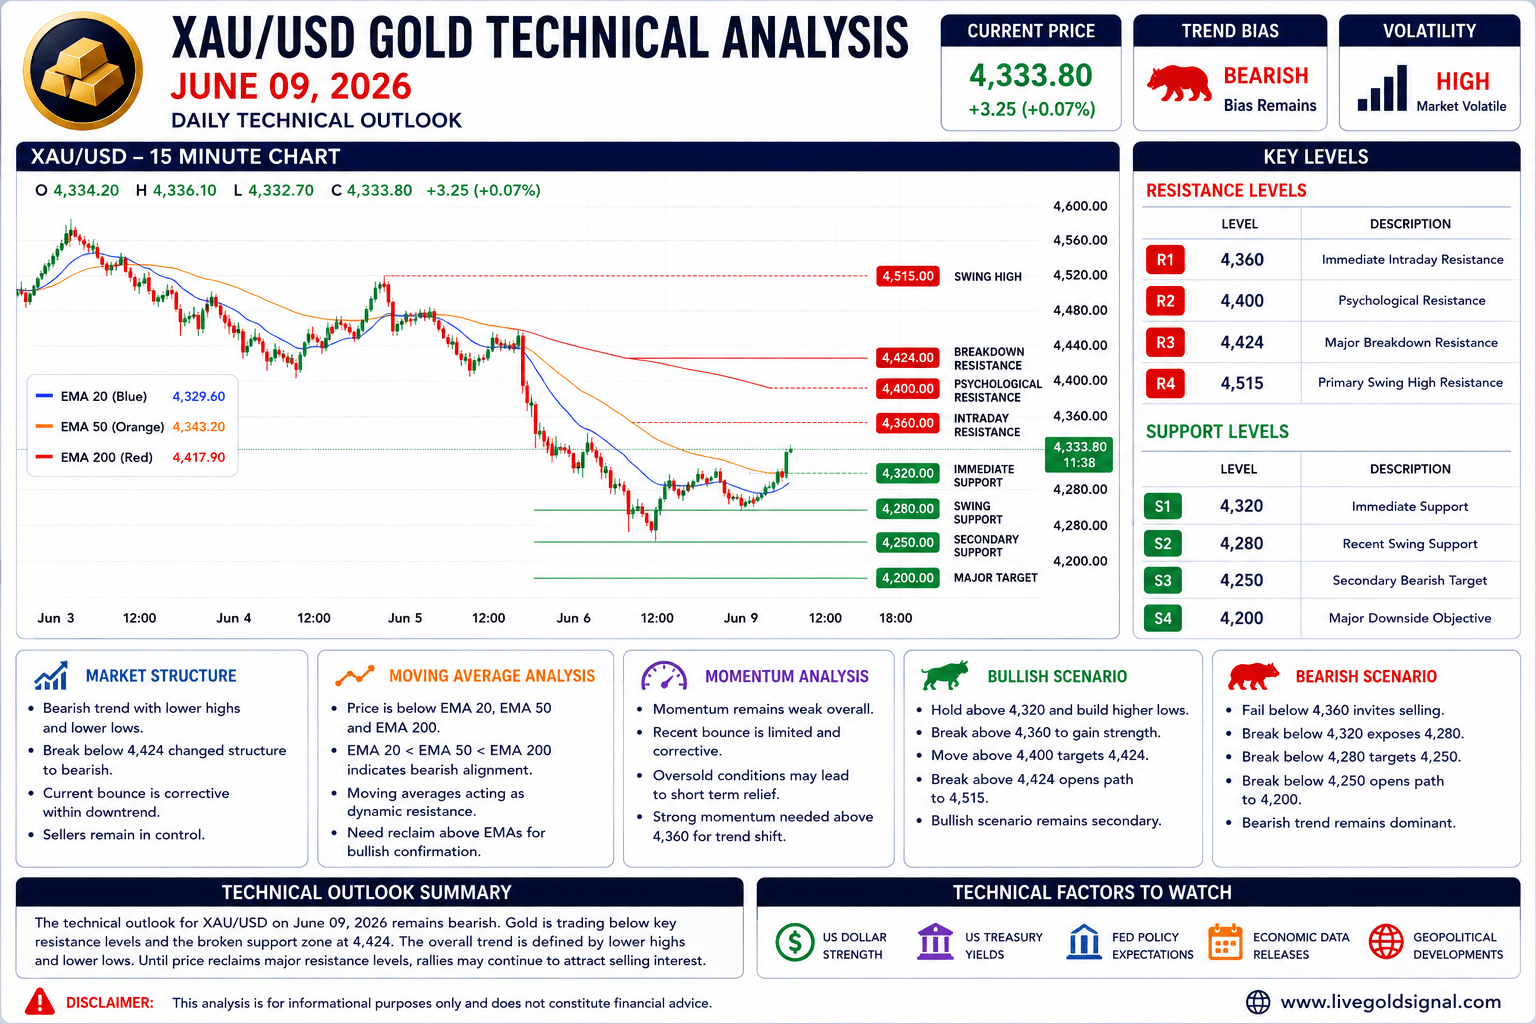
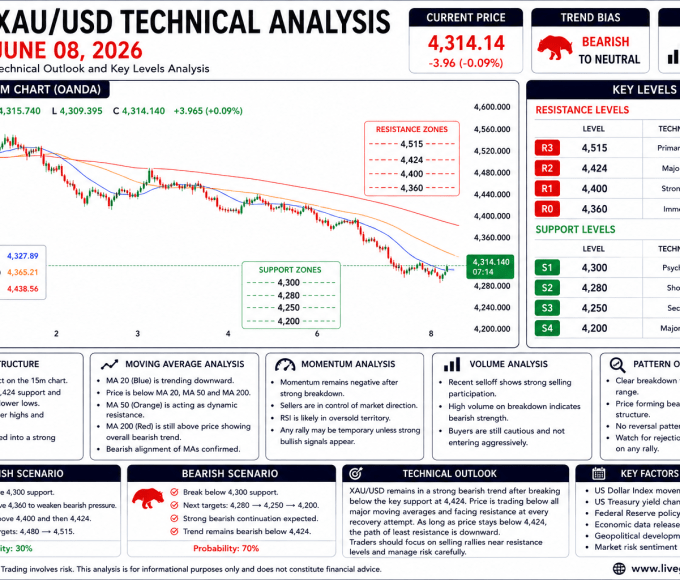
Gold (XAU/USD) continues to trade under bearish pressure during the early European trading hours as the market attempts to stabilize following last week’s aggressive selloff. Based on the latest price structure, gold is currently trading near the 4,330 region after recovering modestly from recent lows. Although buyers have managed to trigger a short-term rebound, the broader technical structure remains bearish because price continues to trade below major resistance zones and below key moving averages.
The recent decline below the important 4,424 support area significantly altered market sentiment. What was previously a strong support zone has now become a major resistance region. Sellers remain in control of the overall market structure, while buyers are currently attempting to establish a corrective recovery rather than a confirmed trend reversal. Until the market can reclaim key resistance levels, the dominant technical bias remains tilted toward the downside.
Market Structure Analysis
The current market structure clearly reflects a bearish trend. The chart shows a sequence of lower highs and lower lows that has been developing since the rejection from the major swing high zone near 4,515. After multiple failed attempts to break above resistance, gold eventually experienced a sharp downside breakout that pushed prices below the previously respected support area around 4,424.
Following the breakdown, selling pressure accelerated significantly and drove the market toward the 4,280 area. Such aggressive bearish movement often indicates institutional participation because price moved through multiple support levels without significant resistance from buyers.
The current rebound appears corrective in nature. Buyers have managed to lift prices from recent lows, but the recovery remains limited compared to the magnitude of the previous decline. This suggests that short covering and profit taking may be contributing to the current upward movement rather than genuine bullish accumulation.
As long as price remains below the broken support zone at 4,424 and well below the major swing resistance near 4,515, the overall market structure continues to favor sellers.
Moving Average Analysis
Moving averages continue to support the bearish outlook. The shorter-term moving averages remain positioned below longer-term moving averages, reflecting persistent downside momentum throughout recent trading sessions.
The EMA structure suggests that sellers continue to control the trend despite the current recovery attempt. Price remains below the major moving average cluster, which often acts as dynamic resistance during bearish market conditions.
For a stronger bullish outlook to emerge, gold would need to reclaim and maintain trading above the key moving averages. Until such confirmation occurs, rallies toward moving average resistance zones may continue attracting fresh selling pressure from market participants looking to trade in the direction of the prevailing trend.
The current positioning of the moving averages indicates that momentum remains negative from a broader perspective. Therefore, traders should continue monitoring price reactions around major EMA levels for signs of either continuation or reversal.
Momentum Analysis
Momentum conditions remain mixed but continue to favor the bearish side overall. The recent recovery demonstrates that buyers are attempting to defend lower levels after the aggressive decline. However, the strength of the rebound remains relatively limited when compared to the previous bearish impulse.
Strong bearish moves are often followed by temporary consolidation or corrective rallies before the dominant trend resumes. The current market behavior appears consistent with this pattern. Unless buyers can generate sufficient momentum to reclaim critical resistance levels, the recovery may remain temporary.
Momentum traders will likely focus on whether gold can sustain gains above nearby resistance zones. Failure to do so could invite another wave of selling activity and reinforce the bearish trend.
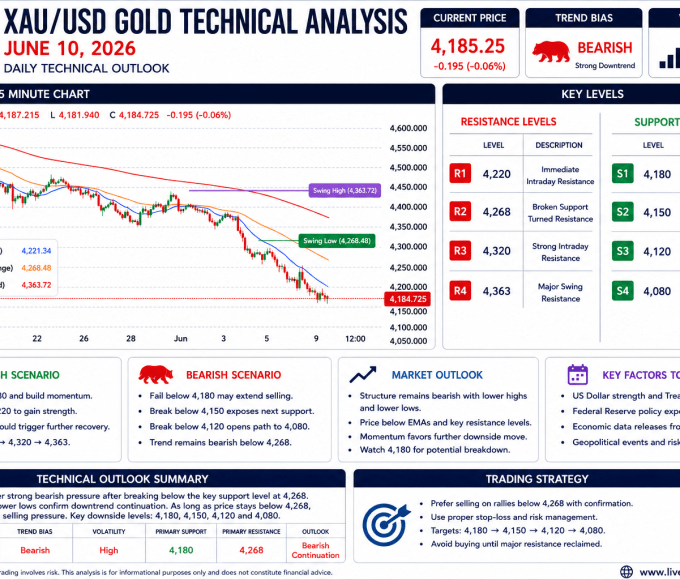
Resistance Levels
| Resistance Level | Description |
|---|---|
| 4,360 | Immediate Intraday Resistance |
| 4,400 | Psychological Resistance Zone |
| 4,424 | Major Breakdown Resistance |
| 4,515 | Primary Swing High Resistance |
Support Levels
| Support Level | Description |
|---|---|
| 4,320 | Immediate Support |
| 4,280 | Recent Swing Support |
| 4,250 | Secondary Bearish Target |
| 4,200 | Major Downside Objective |
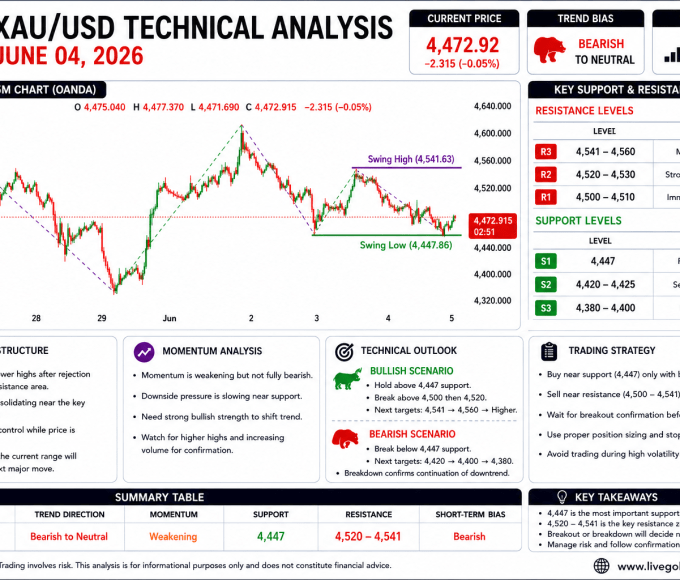
Bullish Technical Scenario
For buyers to regain control, gold must first maintain stability above the 4,320 support area and continue building higher lows. A successful move above 4,360 would represent the first meaningful sign of strengthening bullish momentum.
If buyers manage to break above 4,400, confidence in a larger recovery could improve significantly. The next major challenge would then be the 4,424 resistance area, which previously served as support before the breakdown.
A sustained breakout above 4,424 would suggest that the recent bearish breakdown was potentially exhausted and could open the path toward 4,515. Such a development would substantially improve the medium-term outlook for gold.
However, traders should remember that the bullish scenario currently remains secondary because the broader technical structure continues to favor sellers.
Bearish Technical Scenario
The bearish scenario remains the dominant technical outlook. As long as price remains below 4,424, sellers maintain a significant advantage. Any rallies toward resistance zones may continue to be viewed as opportunities for renewed selling activity.
A failure to sustain the current recovery could quickly shift momentum back toward the downside. If gold falls below 4,320, bearish pressure could intensify and expose the 4,280 support region once again.
Further weakness below 4,280 would likely increase the probability of declines toward 4,250. If market sentiment deteriorates further, sellers could eventually target the major psychological area around 4,200.
From a technical perspective, the bearish trend remains intact until the market proves otherwise through a decisive recovery above key resistance zones.
Volume And Market Participation
Recent price action suggests elevated participation from institutional traders during the breakdown phase. The speed and magnitude of the decline indicate that significant selling pressure entered the market once support levels failed.
Current recovery activity appears less aggressive than the previous selloff, which supports the interpretation that buyers are still operating from a position of weakness. Strong bullish reversals are typically accompanied by sustained momentum and significant volume expansion, which remains limited at this stage.
Monitoring volume behavior near resistance zones will be important throughout today’s session. Strong buying activity above resistance could challenge the bearish outlook, while declining volume during rallies would favor continuation of the existing trend.
Technical Outlook Summary
The technical outlook for XAU/USD on June 09, 2026 remains bearish despite the current recovery attempt. Gold continues to trade below major resistance levels and below the previously broken support zone at 4,424. The broader market structure remains characterized by lower highs and lower lows, which continues to support a bearish trend environment.
Key support remains located at 4,320 and 4,280, while major resistance levels are positioned at 4,360, 4,400, 4,424, and 4,515. The current rebound may continue in the short term, but buyers must reclaim higher resistance levels before a meaningful trend reversal can be confirmed.
Until such confirmation occurs, the path of least resistance continues to point lower. Traders should remain disciplined, monitor key technical levels closely, and maintain proper risk management as volatility remains elevated across the gold market.