
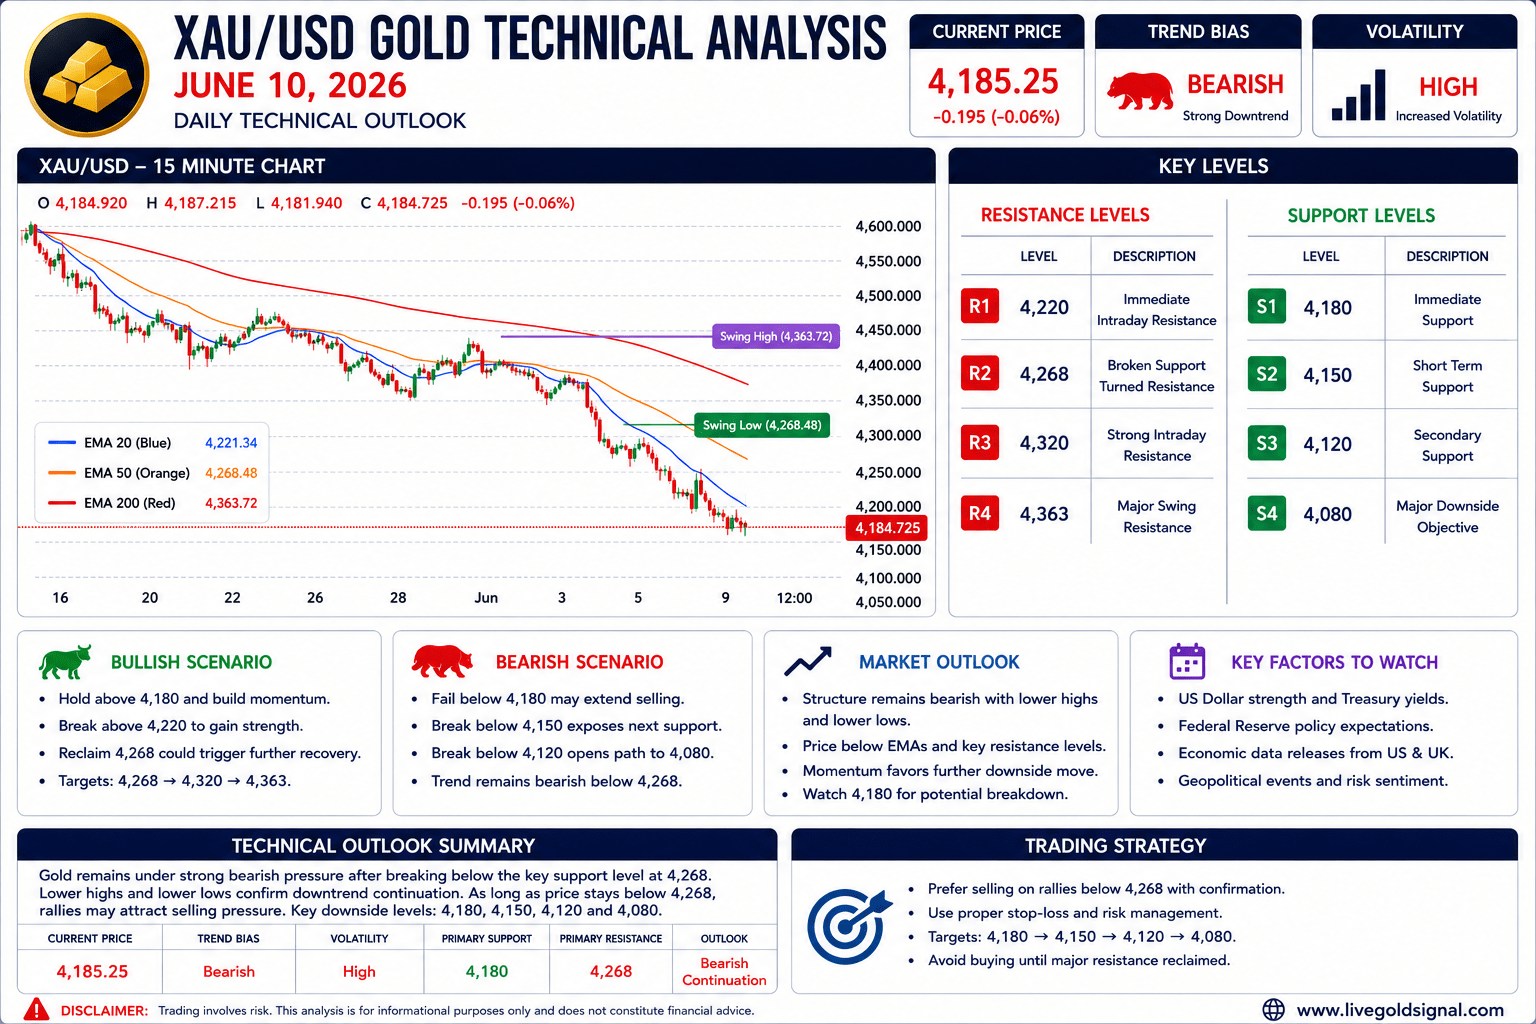
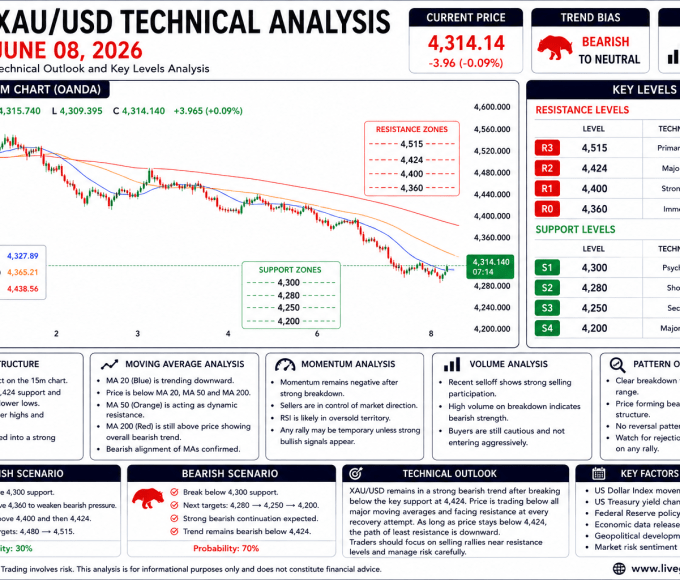
Gold (XAU/USD) continues to trade under intense bearish pressure during today’s trading session as sellers maintain firm control over short term price action. Based on the latest 15-minute chart, gold is currently trading near the 4,185 region after suffering a major breakdown below several key support levels. The recent selloff has significantly weakened market structure and confirms that bearish momentum remains dominant across lower timeframes.
The most important technical development visible on the chart is the decisive breakdown below the former swing support area near 4,268. This level previously acted as a strong demand zone where buyers repeatedly defended price. However, once this support was broken, selling pressure accelerated aggressively and pushed gold toward fresh short term lows. The inability of buyers to defend this major support level indicates that bearish sentiment remains strong and that sellers continue controlling market direction.
Market Structure Analysis
From a pure market structure perspective, gold remains firmly bearish. The chart shows a clear sequence of lower highs and lower lows, which is one of the strongest characteristics of a downtrend. Every recovery attempt over the past several sessions has been rejected before reaching previous highs, confirming the dominance of sellers.
The previous swing high near 4,363 remains the most important resistance level on the chart. This area marks the last major recovery point before the latest collapse occurred. Since that rejection, price has continued creating fresh lows while failing to establish any significant bullish structure.
The breakdown below 4,268 was particularly important because it represented a structural shift in market sentiment. Once buyers lost control of this level, the market quickly entered a liquidation phase that drove price sharply lower. Such movements often indicate institutional selling activity and typically increase the probability of bearish continuation.
Currently, gold remains significantly below both the former swing low and major resistance areas. This confirms that the broader short term trend continues to favor the downside.
Moving Average Analysis
Moving averages continue to support the bearish outlook. The short term EMA remains below medium term averages, while both are positioned beneath longer term trend indicators. This bearish alignment reflects strong downside momentum and confirms that sellers maintain control of trend direction.
Price is currently trading well below the primary moving average cluster. When markets trade beneath major moving averages, these indicators frequently act as dynamic resistance levels. Therefore, any recovery toward moving average zones could attract fresh selling pressure from trend-following participants.
The widening distance between current price and the longer term moving averages also highlights the strength of the recent decline. Although this may occasionally produce temporary corrective rebounds, it does not automatically signal a trend reversal.
For bullish momentum to return, price would need to reclaim the short term moving averages first and then establish sustained trading above medium term averages. At the moment, technical evidence does not support such a scenario.
Momentum Analysis
Momentum indicators would likely remain heavily bearish following the latest breakdown. The speed of the decline demonstrates that sellers continue entering the market aggressively. Strong bearish momentum often persists until significant support levels are reached or buyers demonstrate meaningful accumulation activity.
While oversold conditions may occasionally generate short term relief rallies, these moves should currently be viewed as corrective rather than trend changing. The broader trend remains bearish until proven otherwise.
The latest bounce from recent lows remains relatively weak compared with the magnitude of the previous decline. This suggests that buyers are still struggling to regain control and that bearish momentum remains the dominant force driving price action.
Resistance Levels Analysis
| Resistance Level | Technical Importance |
|---|---|
| 4,220 | Immediate Intraday Resistance |
| 4,268 | Broken Swing Support Turned Resistance |
| 4,320 | Major Recovery Barrier |
| 4,363 | Primary Swing Resistance |
The first major resistance zone sits near 4,220. Buyers need to reclaim this area before any meaningful recovery can begin. Above that level, 4,268 represents the most important resistance because it was previously a strong support zone before the breakdown occurred.
If gold manages to recover above 4,268, sentiment could improve substantially. However, current market conditions suggest that such a recovery remains unlikely without a major catalyst.
Support Levels Analysis
| Support Level | Technical Importance |
|---|---|
| 4,180 | Immediate Support |
| 4,150 | Short Term Bearish Target |
| 4,120 | Secondary Support Zone |
| 4,080 | Major Downside Objective |
The immediate support area remains near 4,180. This zone is currently preventing further downside acceleration. However, repeated testing of support often weakens buyer interest and increases the probability of a breakdown.
If 4,180 fails, sellers could quickly target 4,150. A break below 4,150 may expose 4,120 and potentially 4,080 during the coming sessions.
EMA Trend Assessment
The EMA structure strongly supports bearish continuation. Price remains below the 20 EMA, 50 EMA, and longer term trend averages. This alignment confirms that the path of least resistance remains lower.
Trend traders often look for selling opportunities whenever price retraces toward EMA resistance zones during strong downtrends. Current market conditions continue to support this strategy.
Until gold can establish sustained trading above the major EMA cluster, sellers are likely to maintain the technical advantage.
Bullish Technical Scenario
For a bullish reversal scenario to develop, buyers must first defend support near 4,180 and generate a sustained recovery above 4,220. Such a move would indicate weakening bearish momentum and improve short term sentiment.
If buyers successfully reclaim 4,268, the next upside targets become 4,320 and 4,363. A break above 4,363 would significantly improve the technical outlook and potentially signal the beginning of a broader recovery phase.
However, current market structure does not yet support this scenario as the primary outlook.
Bearish Technical Scenario
The bearish scenario remains the dominant technical outlook for June 10. As long as price remains below 4,268 and below the major EMA cluster, sellers are expected to maintain control.
Any corrective rallies may continue attracting fresh selling pressure. If support at 4,180 breaks, downside targets remain 4,150, 4,120, and ultimately 4,080.
The combination of lower highs, lower lows, bearish moving average alignment, and strong downside momentum continues to support further weakness.
Technical Outlook Summary
The technical outlook for XAU/USD remains bearish on June 10, 2026. The breakdown below the former swing support at 4,268 has significantly weakened market structure and confirmed seller dominance. Current trading near 4,185 suggests that downside pressure remains active while buyers continue struggling to regain control.
Unless gold can recover above 4,220 and eventually reclaim 4,268, rallies are likely to be viewed as selling opportunities. Immediate support remains at 4,180, followed by 4,150 and 4,120. A deeper decline could eventually expose the major downside objective near 4,080.
Based on current price structure, moving average alignment, and momentum conditions, bearish continuation remains the most probable outcome. Traders should remain disciplined, use appropriate risk management, and wait for confirmation before entering positions in what remains a highly volatile market environment.